

Expensive money should be bad for Bitcoin, and it still is. The rally to $86K has been running on a short squeeze and a wave of ETF money, and the squeeze is spent while the ETF money is slowing. So I'm holding my core positions and keeping cash ready for a drop in Q4.
The answer in brief
Bitcoin shouldn't be going up, and yet it's at $86K.
Oil, bond yields and the dollar have all made money more expensive since August. That should be bad for BTC.
As far as I can tell, it's still standing because of a short squeeze, ETF buyers who showed up right after the hike, and spot buying instead of leverage.
The squeeze is one-off fuel, and the ETF money already slowed down a lot in the last week of September. So the Q4 drop I expected in August is still on the table.
What would change my view is yields coming down slowly because oil and inflation cool. Then the contradiction goes away on its own.
I'm not selling, and I'm sitting on cash to deploy through Q4, in no rush.
Expensive money, and the contradiction
In August, I told you I expected crypto to bottom out in Q4.
Since then, the macro picture has only gotten worse for Bitcoin. And Bitcoin has gone up anyway.
The expensive-money argument is simple:
#1: Expensive oil keeps inflation sticky, so the Fed must hike rates.
It did. On 16 September the Fed hiked to 3.75–4%, the first hike since 2023.
And oil hasn't backed off. As I write this, Brent is just under $100 a barrel. WTI spot was at $96 at the end of September, after peaking above $105 in the middle of the month.
#2: High bond yields make cash and bonds a real alternative to risky investments.
For reference, the 10-year went from 4.75% to 5.29% in September alone.
As I write this, it's at 5.26%, just below its 52-week high of 5.35%. The 50-day average is 4.86% and the 200-day average is 4.46%. So this has been building for months.
Why take huge risks holding volatile stuff like BTC when "safe" investments give you over 5% interest...?
#3: Finally, a stronger dollar tightens the global supply of money.
Each of the three above makes risk assets less attractive.
But still... BTC is up... a lot...!?
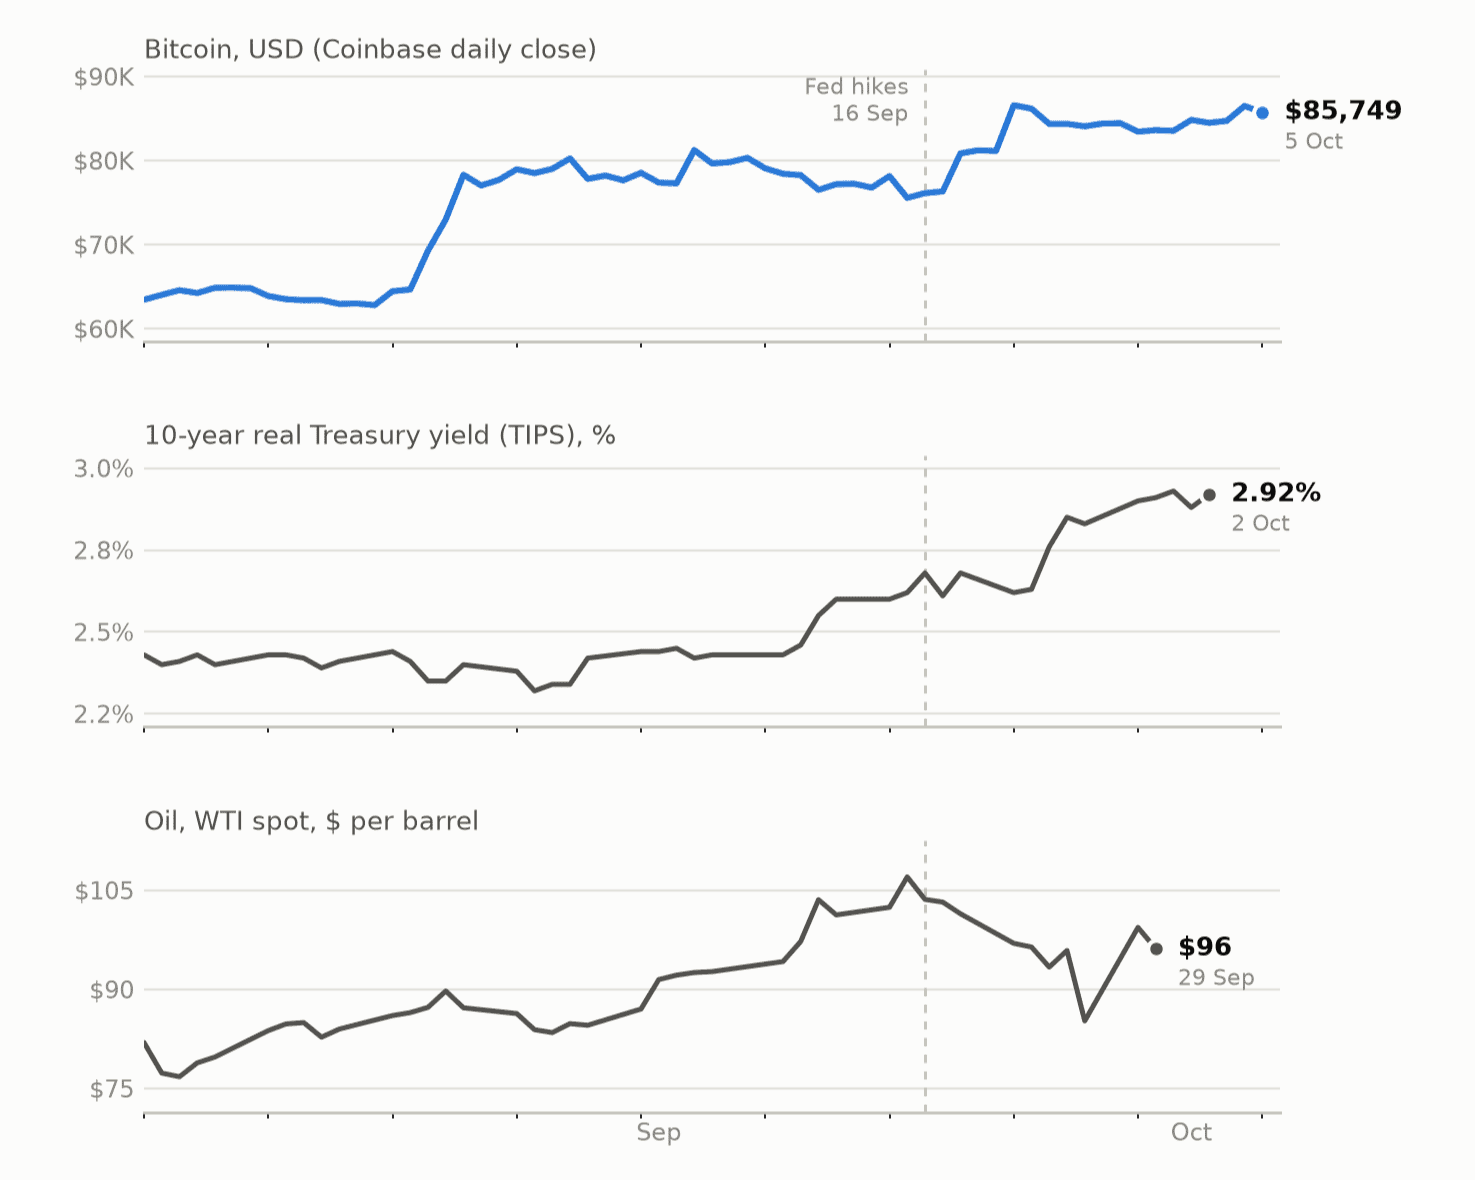
As I write this, Bitcoin is at $86K. That's up around 8% over the last 30 days, 7% above its 50-day average and 20% above its 200-day average.
Look at the chart below. The middle panel is the 10-year real Treasury yield, meaning the yield after inflation. That's the real cost of money. It went from around 2.4% in August to 2.92% on 2 October.
The real cost of money rose for two months straight, and Bitcoin rose with it.
Here's why that doesn't make sense:
Bitcoin is primarily a hedge against the dilution of fiat currency.
When money gets more expensive, we expect less dilution of fiat, and therefore risk assets like BTC to be less attractive.
But now, with oil expensive, rates high, and yield climbing... Bitcoin is going up...
... which makes no sense.
What I want to figure out is what's holding Bitcoin up, and whether it can keep holding through Q4.
If the answer is "macro got better", then I'm wrong about Q4 and I need to rethink the whole thing.
If the answer is something else, then the headwinds are still there.
Reason 1: short sellers got squeezed
As far as I can tell, three things are holding Bitcoin up. I'll take them one at a time, because they are nowhere near equally durable.
First, short sellers.
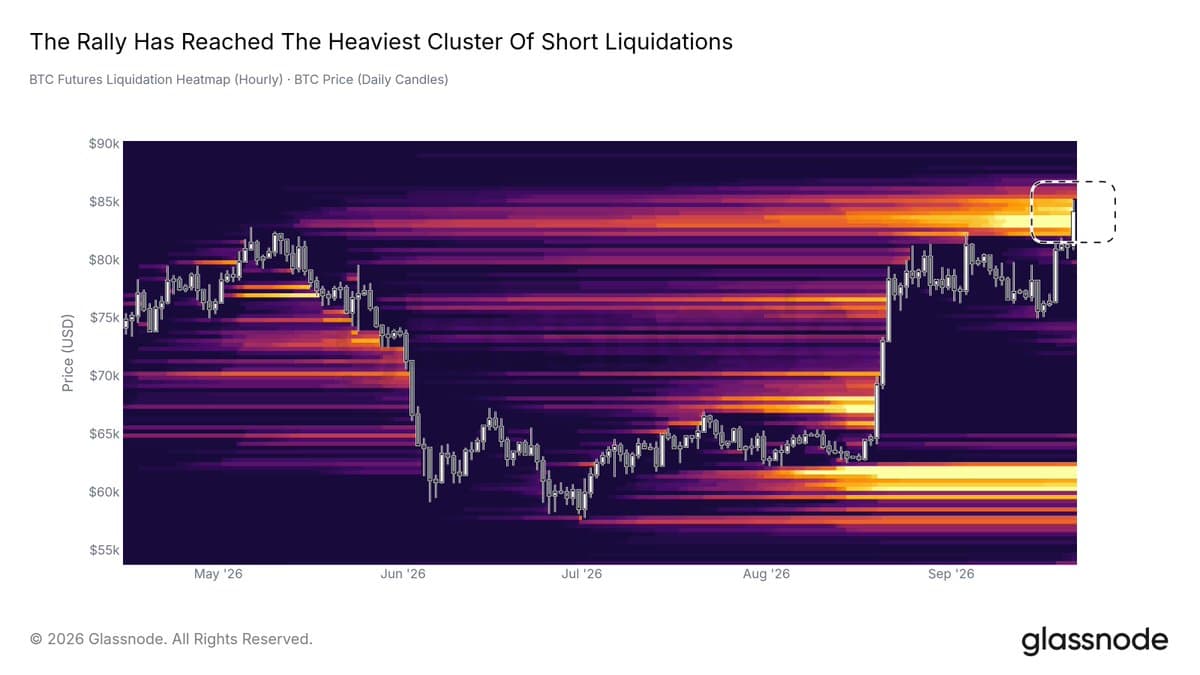
Glassnode tracked shorts piling up between $82K and $86K for months. You can see it in the heatmap below: the brightest band sits at $83K to $86K, and it had been thickening since August.
A short seller borrows Bitcoin and sells it, betting on a lower price. If price goes up instead, the trader has to buy it back, and often the exchange forces the buy. That buying pushes price up further, which forces the next short to buy, and so on.
That's a squeeze. Glassnode put it this way on 21 September: "Now these shorts are the fuel, as these traders are required to buy back BTC."
They also noted that the rejection from this level had been shallow. In other words, price got pushed into the zone, didn't get pushed back out, and then went straight through.
The important point is that forced buying happens once.
Those shorts have bought back now. They don't buy again at $86K because they like the price. So whatever push they gave the market, we've already had it.
That makes the squeeze the weakest of the three reasons. It explains how we got to $86K, but it doesn't tell us whether we stay there.
Reason 2: ETF buyers showed up after the hike
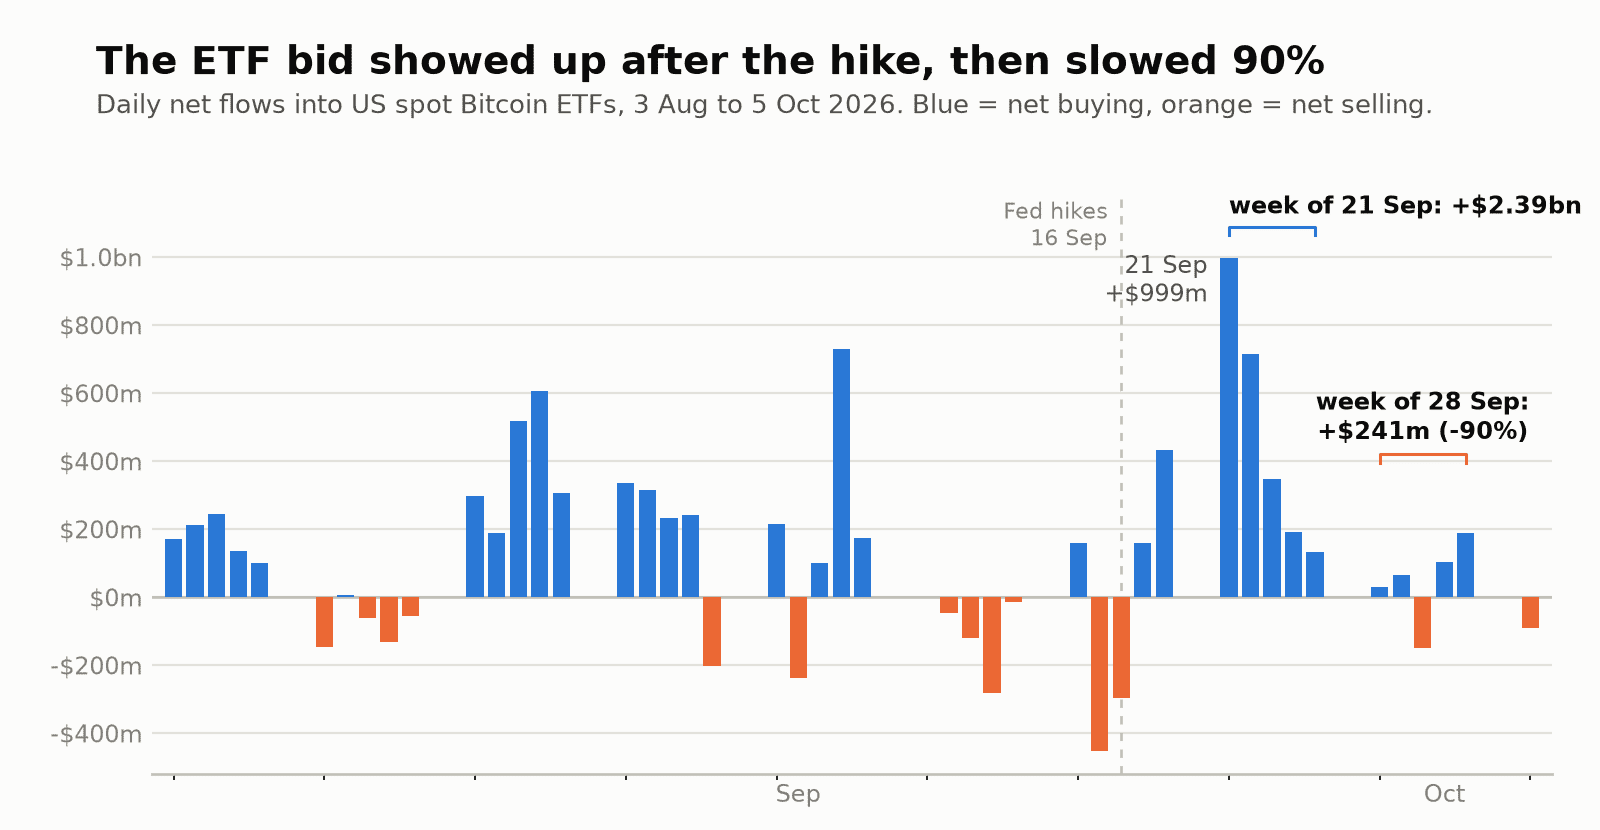
In the two weeks after the hike, US spot Bitcoin ETFs took in $2.93 billion. On 21 September alone, $999 million.
Before the hike, September's flows were actually negative. Look at the chart: the days right before the hike were all net selling, and the two biggest outflows since August landed in that stretch.
So the ETF bid flipped on the hike. Someone decided to buy Bitcoin in size the week after the Fed made money more expensive.
That's the part of the rally I find most interesting, and most puzzling. ETF money is the one source of demand that can keep going for months. Shorts only cover once, while ETF buyers can keep buying every day.
But now look at the right side of the chart.
Week of 21 September: $2.39 billion in net inflows.
Week of 28 September: $241 million. Down 90%.
And the chart ends with a red bar on 5 October.
I don't want to over-read one week. ETF flows are lumpy, and August had quiet weeks too. But the short squeeze got price into the $83K to $86K zone, and the ETF buyers kept it there. Now the ETF buying has slowed down a lot, while price is still sitting at $86K.
What I take from this: the weekly ETF flow number is what I'd watch to decide whether this rally has legs.
If October flows look like the week of 21 September, I'll have to take the rally more seriously, and my Q4 call gets weaker.
If they look like the week of 28 September, then Bitcoin is holding $86K with much less support than the price suggests.
Reason 3: spot buying, instead of leverage
While Bitcoin held near $86K, open interest in Bitcoin futures fell from $38 billion to $36.6 billion.
Open interest is the total size of open futures bets. When it falls while price holds, it means leveraged positions are being closed, and the price is being held up by people buying actual Bitcoin.
Spot buying = good news.
Leveraged buyers get liquidated on the next corrections, making them deeper.
Spot buyers don't.
One caveat: part of that drop in open interest is the shorts from reason 1 closing out. So I don't read the whole $1.4 billion as new spot demand. But the direction is right. There is less leverage under the price, at a time when price is near its highs for the year.
This is the healthiest of the three reasons. It won't push price higher on its own, but it should make the next drop smaller than it would otherwise be.
Putting the three together
So, is the contradiction solved?
It's partly solved.
Macro got worse, and Bitcoin went up anyway, because a crowd of shorts got squeezed and a wave of ETF money showed up right after, with spot buyers underneath.
None of that changes the expensive-money argument. Oil is still near $100. The 10-year is still over 5%. The Fed still hiked.
It only changes the timing. Flows can hold a price up against macro for a while. The question is how long that can last.
Of the three reasons:
The short squeeze is spent.
The ETF bid slowed 90% in the last week of September.
The spot-over-leverage picture is intact, and it's the one that limits the downside.
So the three reasons explain how we got to $86K. My Q4 call is still open.
If anything, price is sitting at $86K after the easy buying, with the macro headwinds still there, and it could hold for weeks before dropping fast once the next buyer doesn't show up.
Which brings me back to what I said in August.
You've just seen Oskar rank the three things holding Bitcoin at $86K: a squeeze that's spent, ETF flows that slowed 90% in a week, and spot buying that limits the downside. That's a live call he first made in August, and it will move again when the October CPI, the Fed meeting and the next weekly ETF flow numbers land. The Solberg Invest community is where Oskar keeps that conversation going between articles: how his read on the flows changes, when the Q4 call strengthens or weakens, and what he's actually doing about it. It's meant for anyone who wants to follow the reasoning as it develops, not just read the next conclusion. See how the Solberg Invest community works
About that Q4 crash I expected
It's still worth understanding the bear case for Q4.
In 2018 and 2022, the midterm years of the past two cycles, the Fed hiked in September.
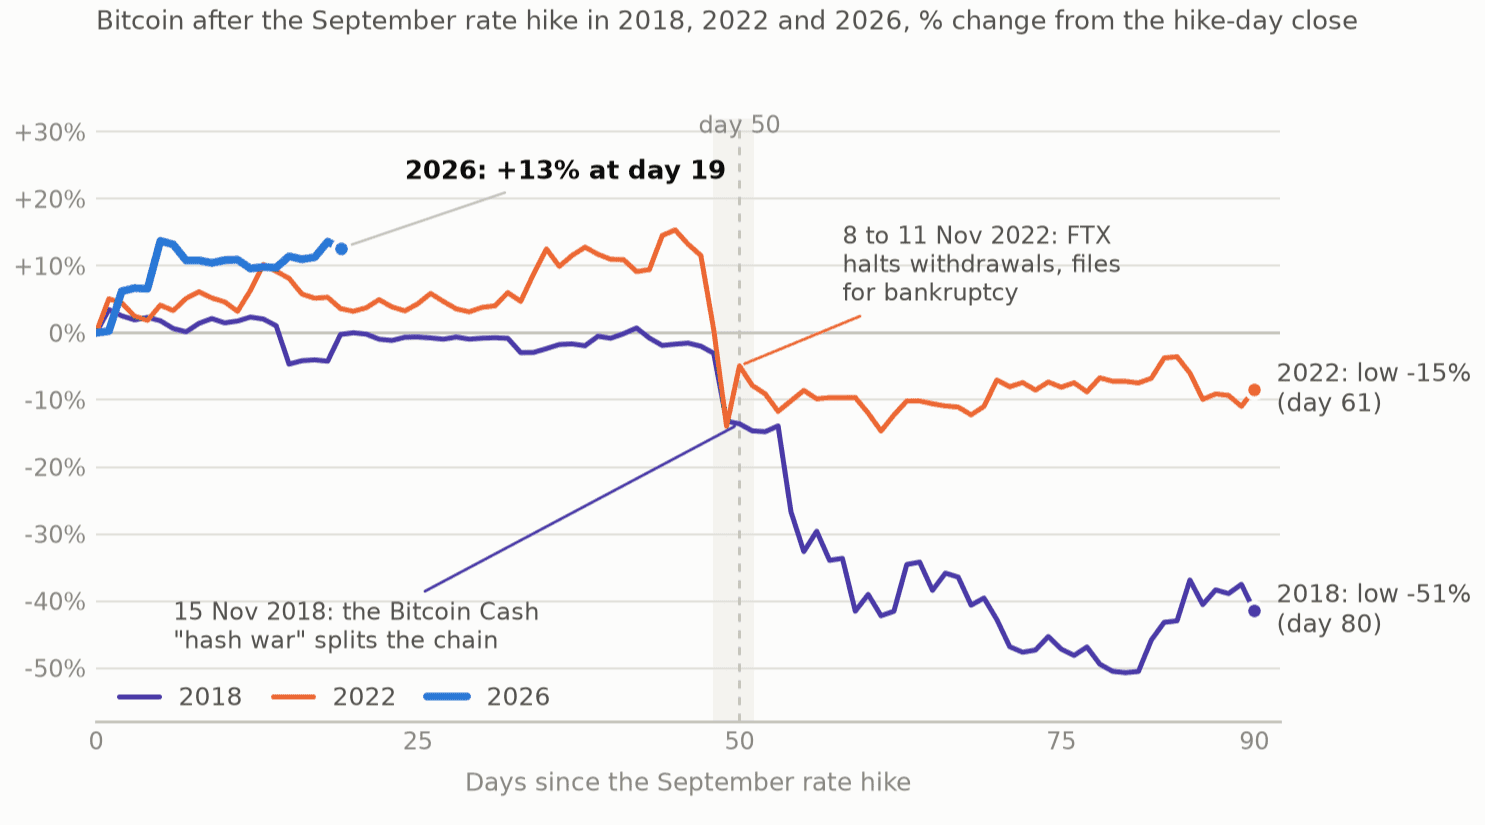
Both times, Bitcoin held near its hike-day price for about seven weeks and then broke lower around day 50.
Day 50 this time is 5th of November.
The chart below measures all three years from the hike-day close. Bitcoin closed around $76K on 16 September this year. From there:
A 2022-style drop of 15% would put Bitcoin around $64K.
A 2018-style drop of 50% would put it near $38K.
For reference, the lowest daily close in the last 90 days was around $62K, back in the summer. So the 2022 case takes us back to where we started in August. The 2018 case takes us well below anything we've seen this year.
Two cases can't establish a seasonal rule.
Furthermore, both crashes had horrible catalysts: FTX in 2022 and the hash war in 2018.
FTX halted withdrawals and filed for bankruptcy between 8 and 11 November 2022. The Bitcoin Cash hash war split the chain on 15 November 2018.
Yes, macro was tightening both times...
But the thing that broke BTC was crypto-specific.
There's also one thing in the chart that works against my own case. Look at the blue line. In 2018 and 2022, Bitcoin was roughly flat at day 19. In 2026 it's up 13%.
So this year isn't following that pattern so far. I can read that two ways.
Either the pattern doesn't apply, because the ETF buyers I described above are something 2018 and 2022 didn't have.
Or we've run up further ahead of the drop, which means there's more to give back.
I don't know which. That's why I care more about the ETF flows than the calendar.
Speculation: maybe the cyclical bear market is supposed to end in Q3, but we're cursed to get a horrible event in November...?
Could yields fall?
Some expect long-term yields to start dropping around mid-November, shortly after the midterms.
But if you hold Bitcoin, you should care more about why than when.
Path A: the pressure lifts. Oil comes down, inflation cools, the Fed can pause, or even cut. Yields fall for the right reason.
This kinda happened in 2023, kickstarting the previous bull market:
The 10-year peaked near 5% that October, reversed without a recession, and the S&P 500 rallied about 16% into year-end.
Bitcoin rallied about 30% over two months, though the spot ETF approval was coming into view by then, so it's not a 1-1 comparison.
If we get Path A, the contradiction I described above disappears. Money gets cheaper while the ETF buyers and spot buyers are still around. That's the case where the Q4 drop simply doesn't happen, and I'd be happy to be wrong.
What Path A needs is oil. With Brent near $100, inflation won't cool on its own. So the first thing I'd look for is oil back in the $80s, and then a CPI number that reflects it.
Path B: something breaks. Investors run to Treasuries for safety. Bitcoin gets sold for cash, first.
I'll go through that one next.
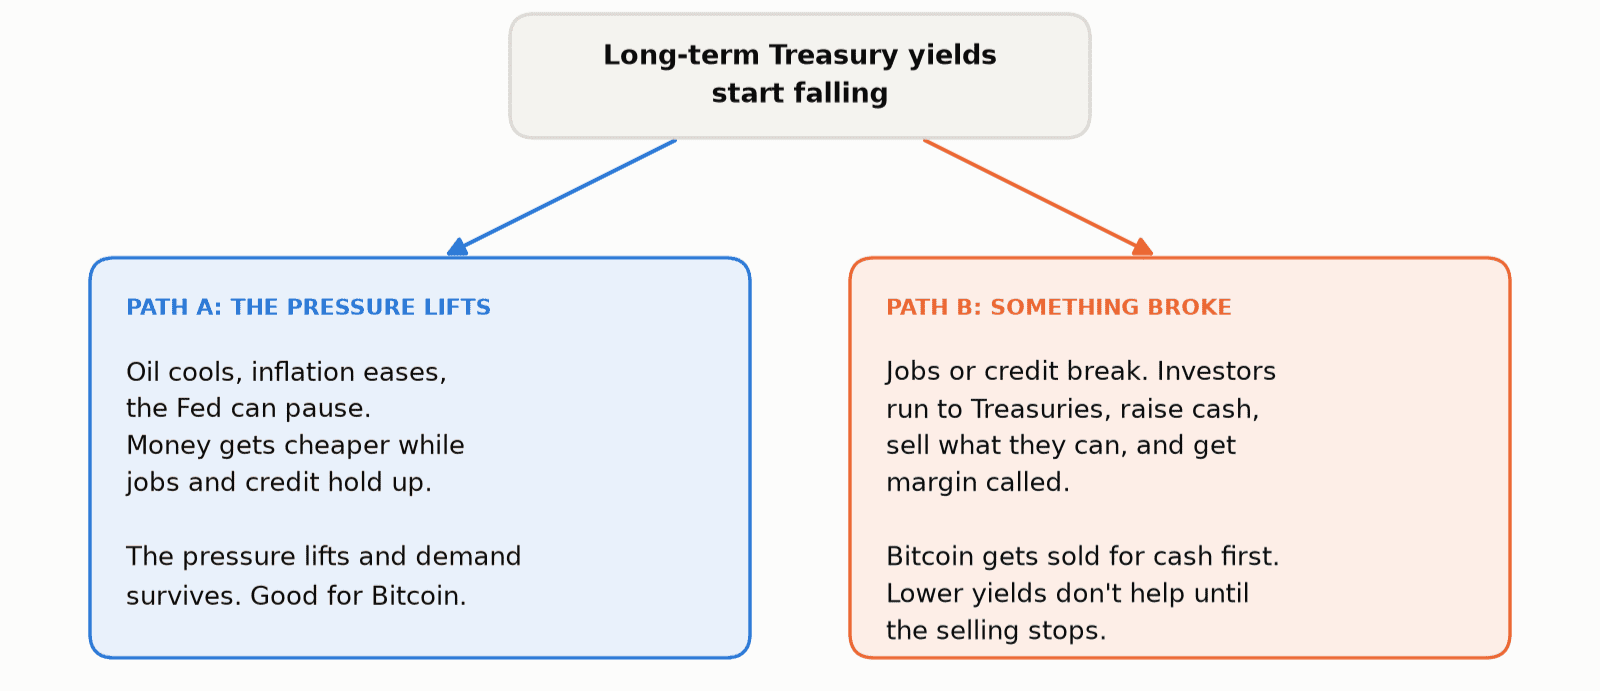
Path B: if something breaks
If something breaks in the economy, the short-term effect on Bitcoin is bad.
The long term effects depends on how the Fed and Governments react.
Take Covid as an example:
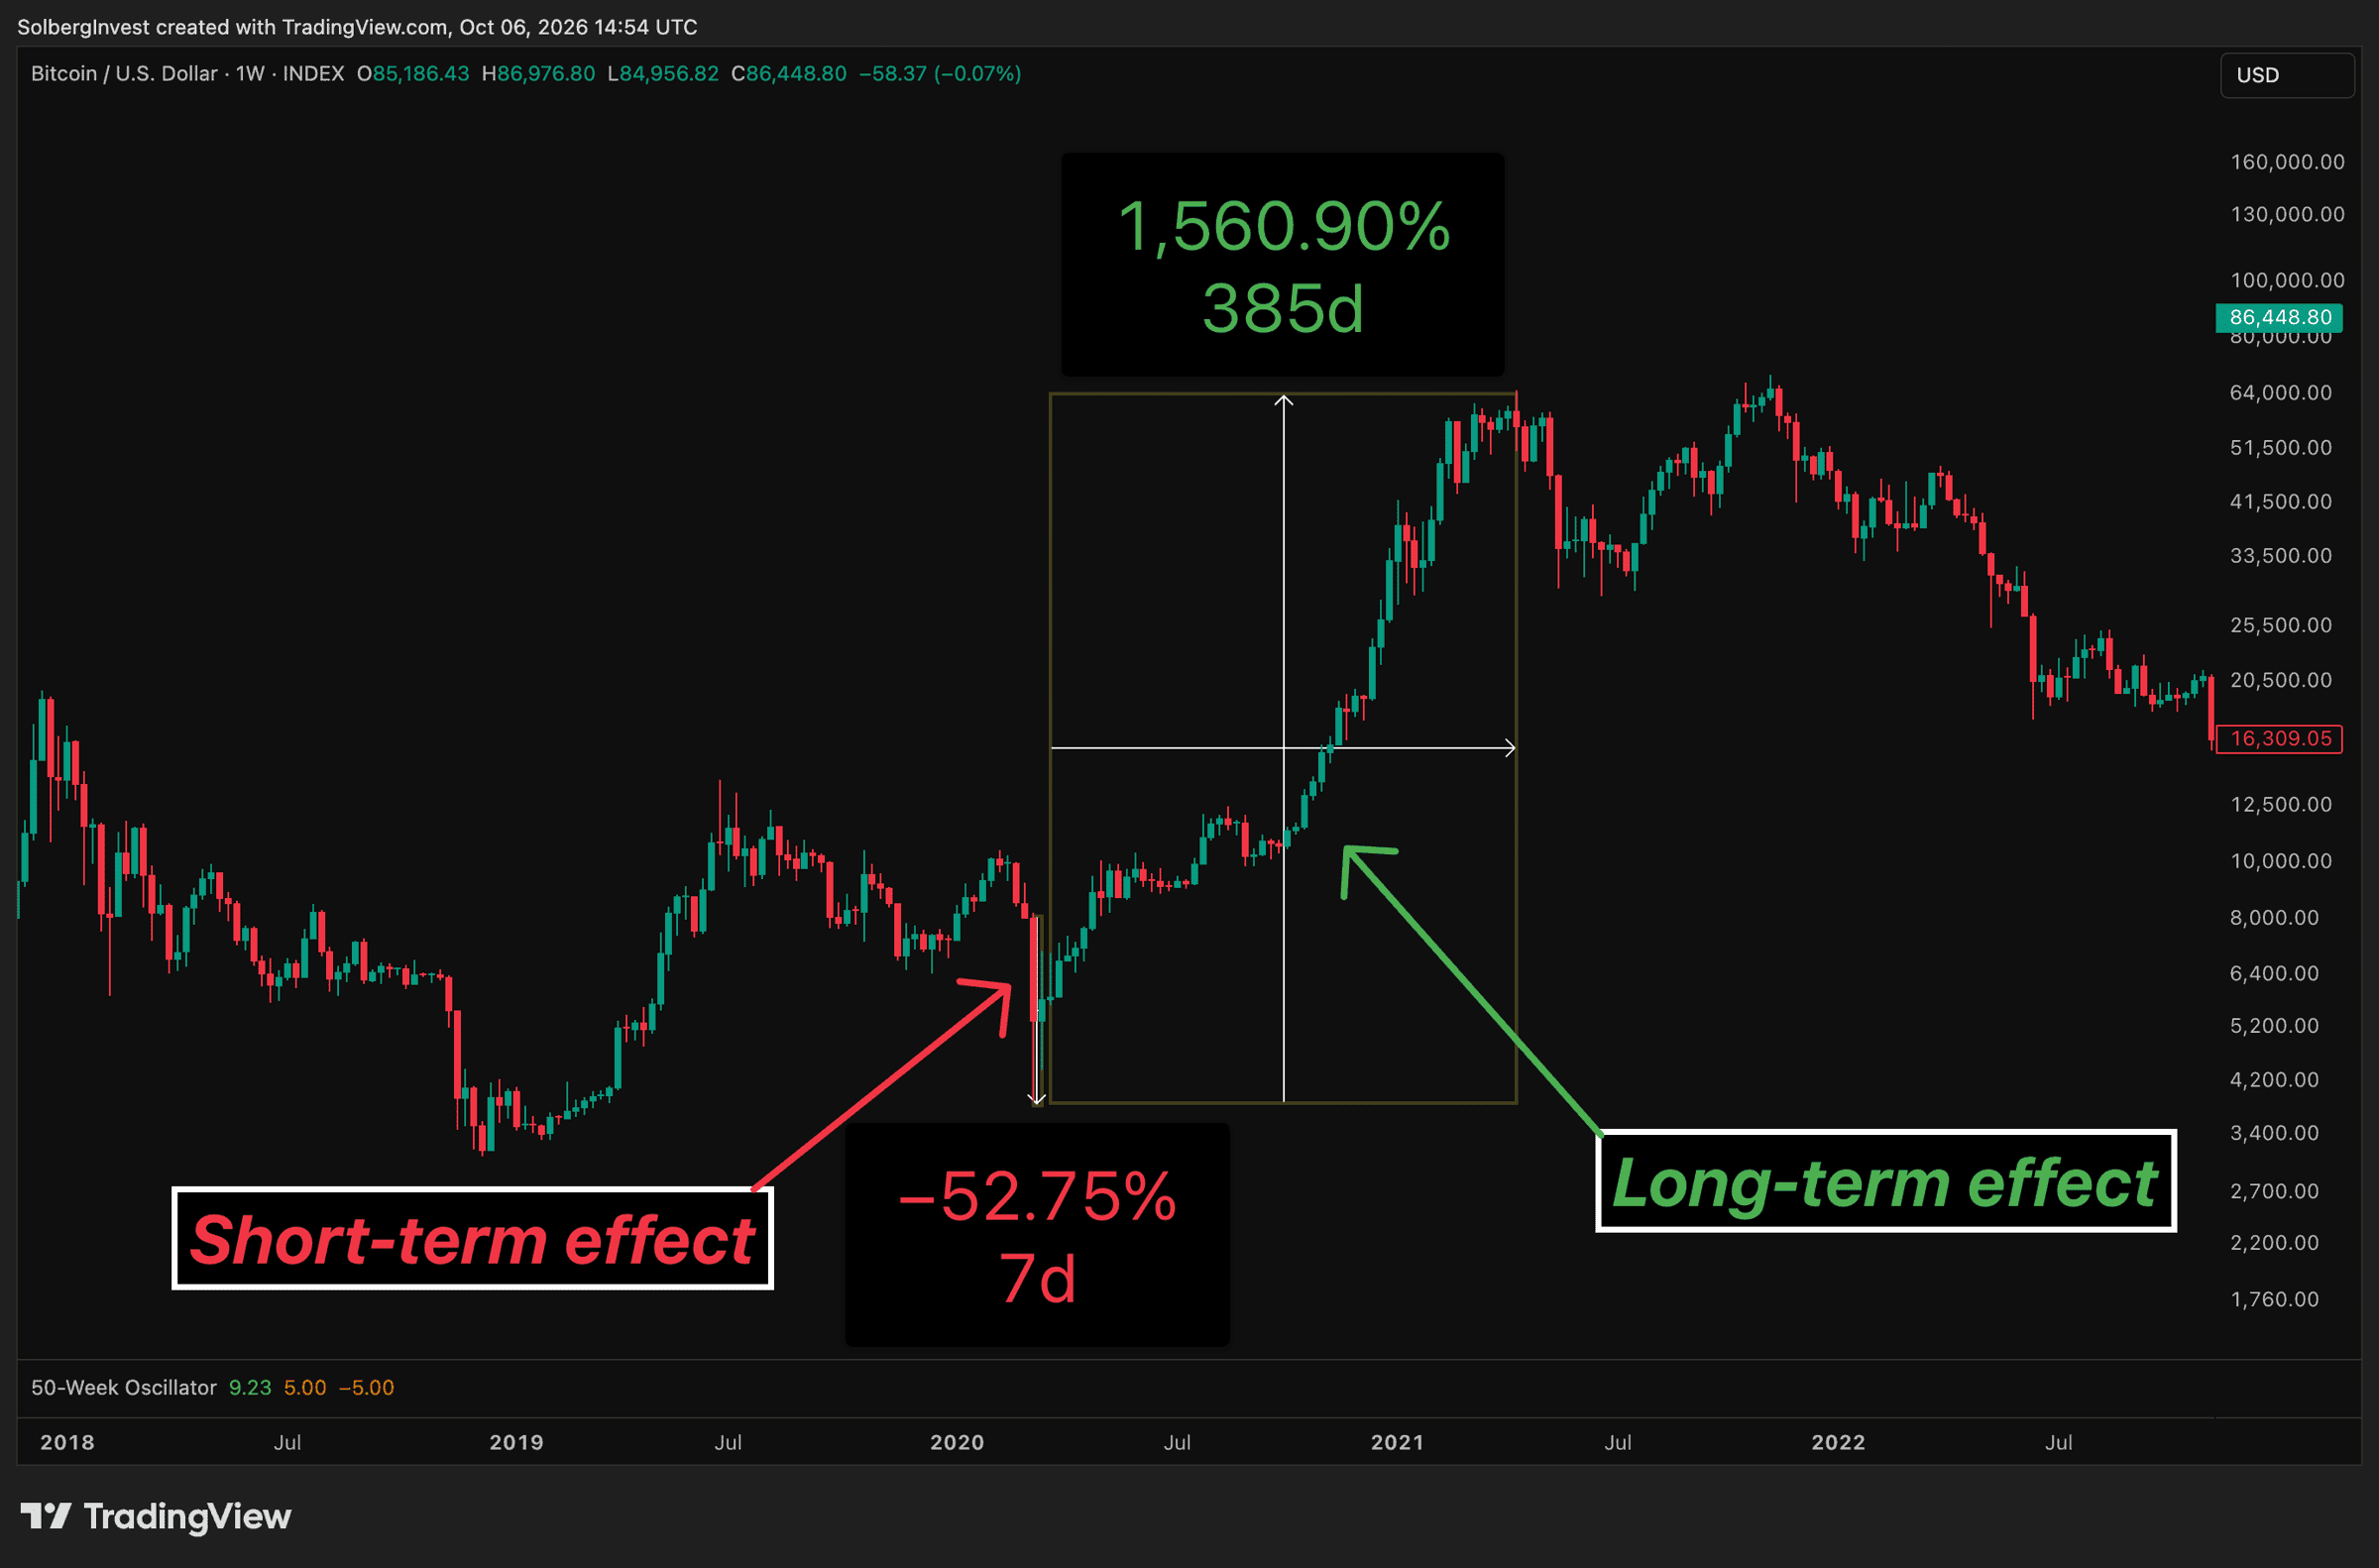
Pandemic and global shutdown = BTC crashed with 50% or so in two weeks. On the weekly chart below, it's a 52.75% drop in 7 days.
The following reaction of literally boosting the money supply by 40% = great for BTC. From that low, Bitcoin went up more than 1,500% over the next 385 days.
Today, jobs are cooling. September payrolls came in at +29,000, with the previous two months revised down by 60,000.
Nothing has broken, but we see cracks every now and again.
Sustained oil prices, leading to higher inflation, leading to another rate hike, could make those job-market-cracks worse.
What worries me is oil staying near $100, CPI staying hot, another Fed hike in December, and a job market that's already cooling tipping over. In that world, yields fall because investors panic, and Bitcoin gets sold first.
Reflection: If yields come down slowly for the right reason, it's good for Bitcoin. If yields come down quickly, for the wrong reason, it's long-term good for Bitcoin (if the reaction is printing money, which is likely). Bitcoin wins either way.
That upside only comes after a painful drop.
Path B goes through a drop first. In the Covid case, that drop was more than 50% in a week. Anyone who was fully invested, or worse, leveraged, only got the long-term upside if they survived the short-term hit.
That's why I'm holding cash into Q4. I want to be a buyer on the day Bitcoin gets sold for cash.
Oskar has laid out his position here. The community is where you follow what he does with it.
The analysis above ends with a position: core BTC and TAO untouched, fresh cash in USDC, no deployment at $86K, and a plan to buy through Q4 rather than before it. Whether Path A or Path B plays out, that plan will have to react to real data on real dates. Following Oskar's macro and fundamental thinking inside the Solberg Invest community means seeing how that cash actually gets deployed, how he weighs each CPI print and jobs report against the Q4 call, and where he admits he was wrong. The value is watching one analyst's reasoning hold up, or change, over time. Learn about the Solberg Invest community
The dates I'm watching going forward
Everything above comes down to oil, inflation, the Fed, and jobs. So these are the dates:
14 October: CPI. Does inflation justify another hike in December? This is where September's oil price shows up in the numbers.
27–28 October: Fed meeting. Looking forward to hearing their reactions to the CPI numbers and job data. A December hike on the table keeps the expensive-money argument alive.
29 October: PCE, the Fed's preferred inflation measure.
3 November: midterms.
5 November: potential curse day...? Day 50 after the hike.
6 November: jobs report. Is the cooling deepening? If payrolls go negative, Path B gets a lot more real.
And one thing that isn't a date: the weekly ETF flow number. If it recovers toward the week of 21 September, the rally has more behind it than I'm giving it credit for. If it stays where the week of 28 September left it, Bitcoin is holding $86K on much less than it looks.
I'll give you an updated view on this once the October data is in.