

A 52-week low only becomes interesting when the business, the financials, the outlook and the valuation line up. Most of the time the drop is justified and a low p/e is a trap. Every now and then the price falls far more than the business, and that gap is what I'm buying.
The answer in brief
A 52-week low gets my attention. It is never, by itself, a reason to buy.
What I'm looking for is a gap between what the company is worth and what the stock is priced at.
Most of the time there is no gap. The stock fell because the business got worse, and a low p/e doesn't fix that.
Every now and then the business keeps growing while the price falls 30–40%. That is where I want to be.
Lululemon is the first kind. On Holding was the second, and further down I'll go through exactly how it has performed since the letter.
Only when the business, financials, outlook and valuation line up does the low become truly interesting.
Stocks fall for a reason
Here is the basic fact.
Stocks fall for a reason:
Earnings are collapsing. Debt is rising. Customers are leaving. Competitors are taking market share. Or the company's products are simply becoming less relevant.
When a stock hits its lowest price in a year, one or more of these is usually true. The market is rarely stupid about the direction.
But sometimes the problem is temporary.
The business is simply having a bad quarter, and nothing fundamentally changed.
A currency headwind. An inventory problem. A quarter where growth came in below what Wall Street had pencilled in.
Price overreacts to that kind of headwind, and will probably come back.
Situations like that present an opportunity, where we can get significant discounts on quality stocks.
The problem is that from the outside, both situations look identical. The chart, headlines and 52-week low label look the same either way.
So the chart tells me nothing about which one I'm looking at. It only tells me the market is pessimistic.
My job starts with finding out why, and if the drop is justified.
The gap I'm looking for
The question I ask is simple: Has the company become as bad as the share price suggests?
That gap between company value and stock price is what I'm looking for.
A stock might fall 30–40% because revenue growth slows from 20% to 12%.
Notice what actually happened there. Revenue didn't fall. It is still growing 12%. It just grew slower than people hoped.
Slower growth is obviously not great.
BUT, the company may still be growing, generating plenty of cash, carrying little debt and holding the same competitive advantages it had before!
The question then isn't whether something negative happened... It's whether the market punished the stock more than it deserved.
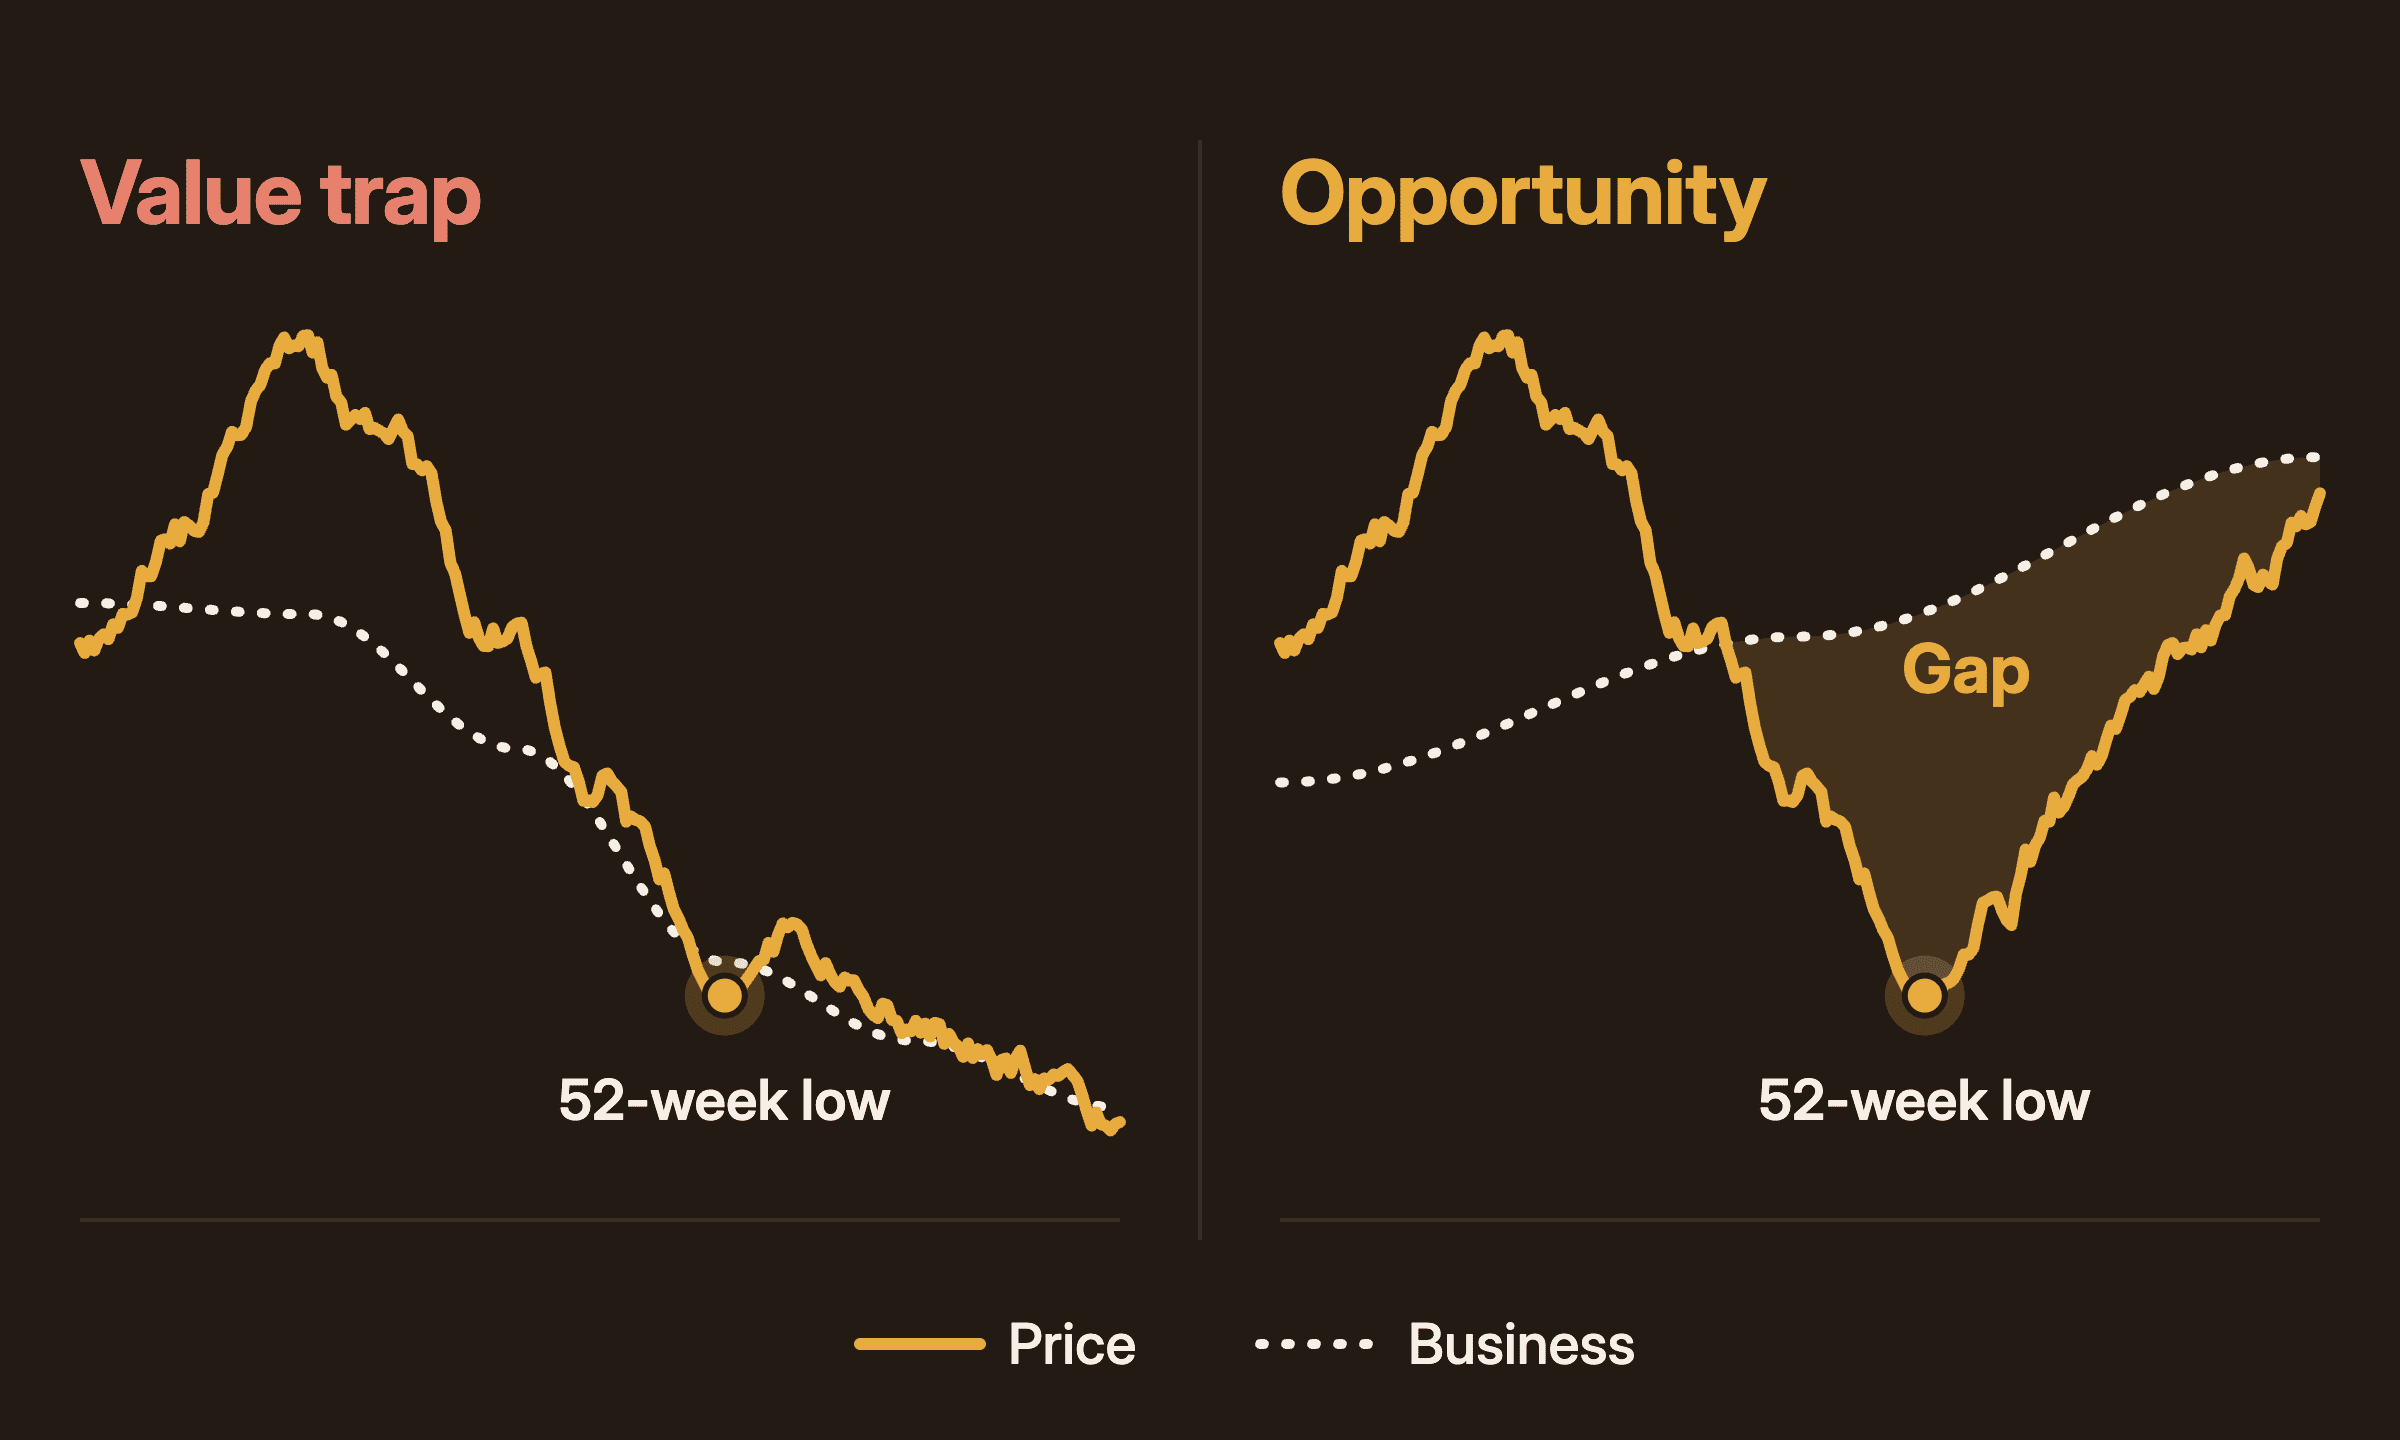
In the picture below, that is the difference between the two charts. In both, the price falls to a 52-week low. In the value trap, the business (the dotted line) is falling right along with it, and keeps falling after. In the opportunity, the business keeps climbing while the price drops below it. The shaded area is the gap.
Here is the harder part.
More often than not, the drop is justified.
Maybe the stock "looks cheaper" by different multiples and valuation-metrics, but revenue in fact stagnates, or margins continue to decrease quarter after quarter.
That's a classic value trap!
In practice, a 52-week low screen will give you a long list. Most of the names on it deserve to be there. If you treat the list as a buy list, you will own a lot of shrinking businesses at prices that keep getting "cheaper".
The list is only a starting point. The work comes after.
What I actually check
"Okay cool... So how do you separate a value trap from an opportunity?"
Oskar, when I explain this strategy to him.
Four things need to line up: the business, the financials, the outlook and the valuation.
If one of them fails, I pass. I don't care how cheap the p/e is.
The business. I want to understand how the company makes money, whether the business model can scale and whether it has competitive advantages that can protect profitability over time. If I can't explain why customers will still pay for the product in five years, I have no business guessing whether the quarter was temporary.
The financials. This is where the share price and the financial statements often tell different stories. I look at revenue growth, EBIT margins, free cash flow, debt and the balance sheet. A couple weak quarters doesn't necessarily mean you have a bad company. Revenue still growing, margins still strong, cash flow positive, little debt, management still investing for growth... that is a healthy company having a bad period.
The outlook. This is the part most people skip. I go back through previous quarterly reports to answer questions like:
What did management promise? Did they deliver? Are they constantly lowering guidance, or are they doing what they said they would?
One guidance cut, followed by delivering on the new number, I can live with. A cut every quarter is a pattern, and the pattern is the business getting worse.
The valuation. Even a fantastic company can be a terrible investment if you pay a high price for it. A stock that has fallen 40% from a p/e of 80 can still be expensive. A stock that has fallen 40% from a fair price is probably cheap. The starting point matters as much as the drop.
Then I sort the problem itself into temporary or permanent.
Temporary: currency headwinds, an inventory problem, a quarter where growth was 15% instead of the 20% Wall Street expected. Happenings like that don't last forever. A temporary inventory problem doesn't destroy a business model.
Permanent: customers leaving, comparable sales falling, margins decreasing quarter after quarter, management lowering the bar again and again.
The two companies below show exactly what each one looks like.
Lululemon: cheaper by every metric, and still a value trap
Lululemon is a classic value-trap.
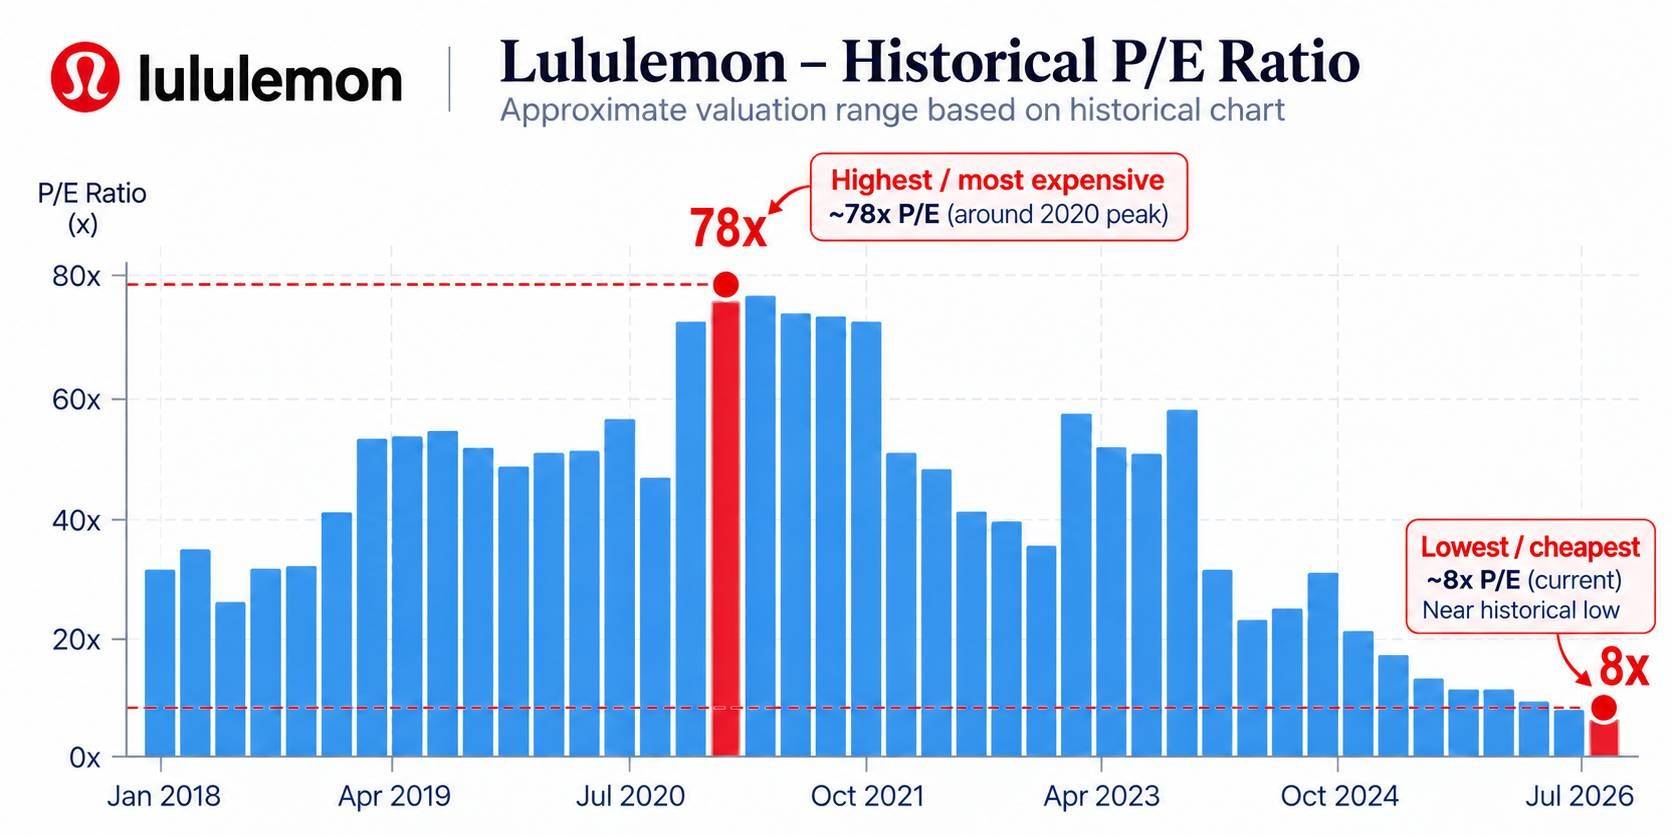
Previously the company's stock was trading at a p/e close to 80 - the chart below has the peak at roughly 78x around 2020. Now the p/e is around 8.
10x cheaper by the metrics - must be a steal, right?!
Wrong!
Run it through the four checks.
The business. Still a strong brand. Still earns good money. As I write this, the operating margin is around 16–17% and the company generated over a billion dollars in free cash flow over the last twelve months. This is not a company that is about to disappear.
The financials. Here it starts to crack. Revenue is down around 4% over the last twelve months. In Q2 2026, revenue fell 4%, comparable sales fell 9%, and comparable sales in the Americas fell 12%. Even its core leggings category reportedly fell around 20%. Operating income fell 13% in the quarter. The balance sheet is fine, but note that the company now carries more debt than cash.
The outlook. This is where it fails for me. The management has for the entire 2026 been guiding at pressure on operating margins. They have cut full-year guidance again and now expect 2026 revenue to decline 5–7%. Twice in one year. That is the pattern I described above.
The valuation. There is a detail the p/e of 8 hides. As I write this, the trailing p/e is around 8.7. The forward p/e is around 12. The forward number is higher than the trailing number. That only happens when the market expects earnings to fall, a lot. So the "8x" is based on earnings that nobody, including management, expects to repeat.
The earnings are shrinking, and the price is simply following them down.
When it seems like a good buy by the metrics, like p/e (Lululemon), you need to understand the bigger picture. Meaning the business, financials, outlook and valuation. Lululemon's financials and outlook don't look promising.
What would change my mind: comparable sales in the Americas would need to stop falling, and management would need to go two or three quarters without cutting the number again. Until then the low multiple is a warning, and I stay away.
If you own it because "it's never been this cheap", that is the question you need to answer. You need to ask what it's actually cheap relative to.
You have just watched Simen run a stock that looks ten times cheaper by p/e through all four checks and reject it, and then name the two things that would make him reconsider: Americas comparable sales stopping their fall, and management going two or three quarters without cutting the number again. That verdict is a snapshot. The conditions behind it get tested with every report. In the Solberg Invest community you follow Simen's reasoning as those reports land, so you see whether the value-trap pattern confirms itself or starts to break, instead of meeting his conclusion once and losing the thread. See how the Solberg Invest community works
On Holding: the same chart, a different business
On Holding is most likely not a value trap.
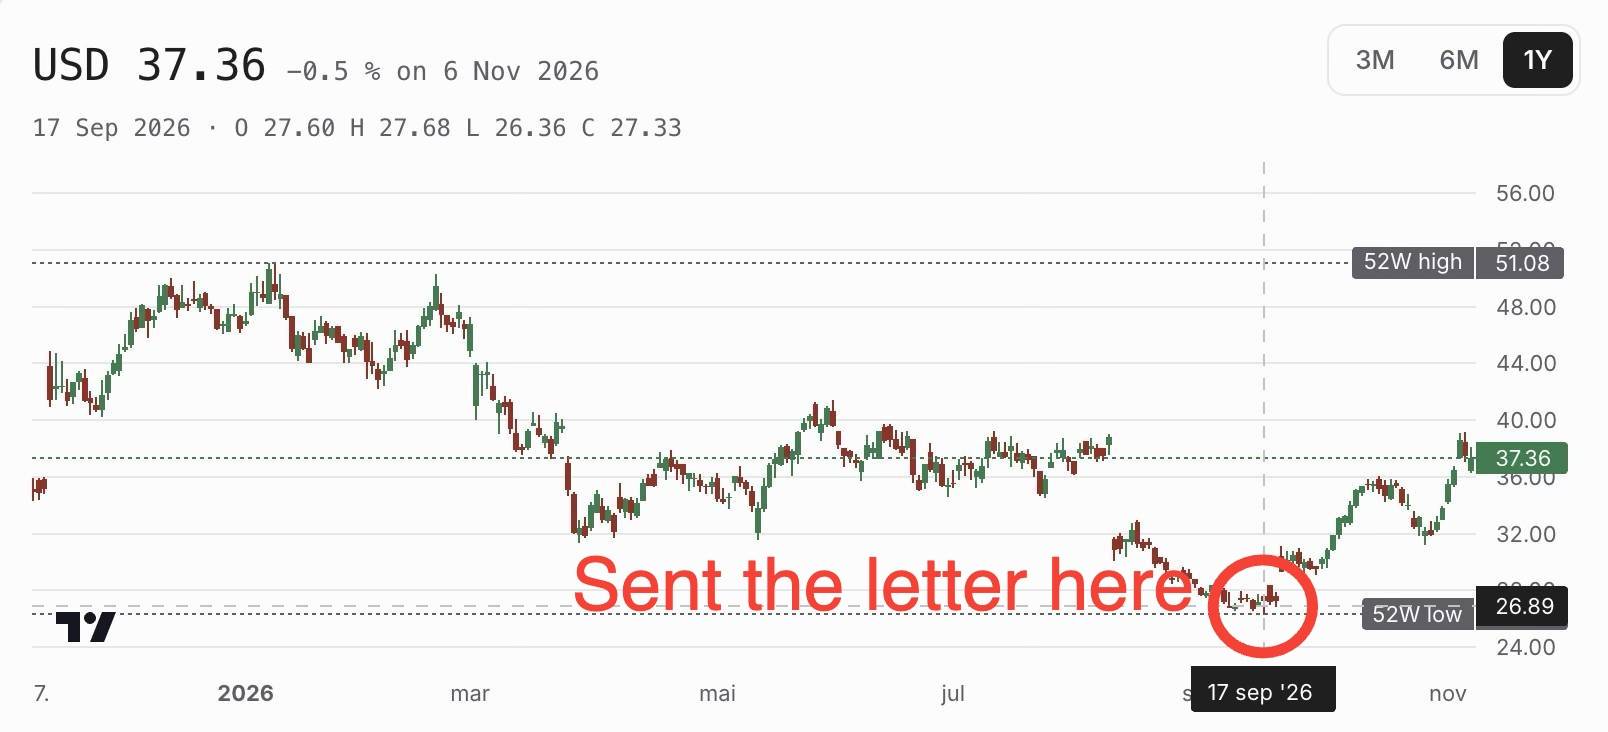
I sent you a letter on this company while it was at its 52-week low on September 17th. The chart below shows where.
So why was On Holding trading at a 52-week low?
Two reasons, and neither of them was the business falling apart.
First, a previous high valuation. The stock had a 52-week high just above 51 dollars. At 27 dollars in September it had roughly halved, and most of that drop was the premium coming out of the price.
Second, the market didn't like a lower guidance. On August 11th, with the Q2 report, management lowered the full-year sales growth outlook, mainly on slower growth in the Americas. The stock fell around 20% that day. Then it kept drifting lower for another five weeks.
Now run the same four checks.
The business. They built the brand first, and now they are building out the business behind it. A premium product, a gross margin around 67% as I write this, and a model that scales across geographies and categories. Those margins are the competitive advantage. People pay full price for the shoes.
The financials. The share price fell sharply, but the financial statements tell a different story. Revenue growth is still around 17% over the last twelve months. Operating margin is around 15%. Operating cash flow is strong. The company holds about 1.3 billion CHF in cash against about 0.7 billion in debt, and the current ratio is above 3.
A company growing 15–17% isn't suddenly terrible just because Wall Street expected 20%.
The outlook. When they lowered the sales number in August, they raised the gross margin outlook and kept the profitability outlook at the same time. So the business was becoming more profitable per shoe while growing slower in one region. That is a different problem from Lululemon, where sales, comps and operating income are all going the same direction.
The valuation. At 27 dollars, with the growth and margins above, the price no longer assumed perfection. That is the moment the 52-week low gets interesting.
On Holding was a great company, but expectations from Wall Street were too high, so it overcorrected, creating a great opportunity for investors like us.
How On Holding has actually gone since the letter
I told you in the email it was up 40% since the letter. The number has moved, so here is the precise figure.
From the close on September 17th, the stock peaked at a gain of around 41% in early November. When I made the chart above, on November 6th, it was up around 37%.
Then came the Q3 report on November 10th, and the stock fell around 7% on the day. As I write this, it trades at about 33.6 dollars. That is up about 23% from the letter.
Still a very good result in two months. I'd rather give you the current number than the highest one it touched.
Two more things are worth noting, because they are the strongest arguments against my own case.
The guidance record is mixed, not spotless. In May, management kept the full-year outlook. In August they cut the sales growth number. Since then they have held the revised number, both at their investor day in late September and again with the Q3 report. So the record is one cut, followed by delivery on the cut. That passes my test, though a second cut would not.
Part of the rebound was new information. Five days after my letter, On held an investor day where they presented a new strategy, targets out to 2029 and the company's first share buyback programme. The stock jumped around 7–8% that day on very heavy volume. So I can't claim the whole move was the market simply changing its mind about the same facts. Some of it was new facts.
That doesn't change my view. The business was fine at 27 dollars before the investor day. The investor day confirmed it. That is what you want to happen after you buy at a 52-week low, where the next piece of news agrees with the financial statements and the gap closes.
Where it stands now. The stock is above its 50-day average but still below its 200-day average, and still roughly a third below the 52-week high. The trailing p/e is around 20 and the forward p/e around 16. It is not the bargain it was in September. It is a growing, cash-generating company at a reasonable price.
What would change my mind: another cut to the sales growth outlook, gross margin starting to slip, or the Americas failing to stabilise over the next two reports. I update the analysis in the Terminal after each report, and those are the three things I look for first.
"But doesn't the market already know all this?"
Oskar, confused.
Yes. Mostly.
If a company just reported a weak quarter, the market knows. I rarely have information that everyone else somehow missed.
But investors can disagree massively about what that information means for the next three to five years.
A company misses quarterly expectations and the stock gets crushed. Six months later, the problem turns out to have been temporary, earnings continue growing and suddenly that 30% sell-off looks rather dramatic.
The opportunity isn't necessarily knowing something the market doesn't: It's understanding the same information differently.
The day On Holding fell 20%, everyone had the same press release. The sellers read "growth is slowing in the Americas" and left. I read "growth is slowing in the Americas, margins are rising, cash is piling up" and started working.
Same information, read on a different time horizon.
And this is the part that matters for you. The edge in this strategy is not cleverness. It is being willing to own a stock during the months when it looks wrong, because you have done the work on the business and the people selling are reacting to the quarter.
It always hurts to go against the market-sentiment. On Holding kept falling for five weeks after the guidance cut, and it did not feel good sending that letter at the low. It can surely pay off, but you have to be able to sit through that period.
If you can't, buy the stock after it has recovered 20% and accept the smaller gain. That is a perfectly fine choice, as long as you make it deliberately.
Holding through the months when a stock looks wrong is a different task when you can follow the analyst who wrote the case.
This section is the core of the strategy. Simen's edge on On Holding was not secret information. Everyone had the same press release. The edge was reading it on a longer time horizon and then sitting through five weeks of the stock falling further after he sent the letter. He has also just told you how he keeps that view honest: revisiting the case after each report and checking three specific things first. Following that work over time, as his view holds or changes with the facts, is what turns the uncomfortable waiting period into a deliberate decision rather than a guess. That is what the Solberg Invest community is built around. Learn about the Solberg Invest community
The 52-week low label in the Terminal
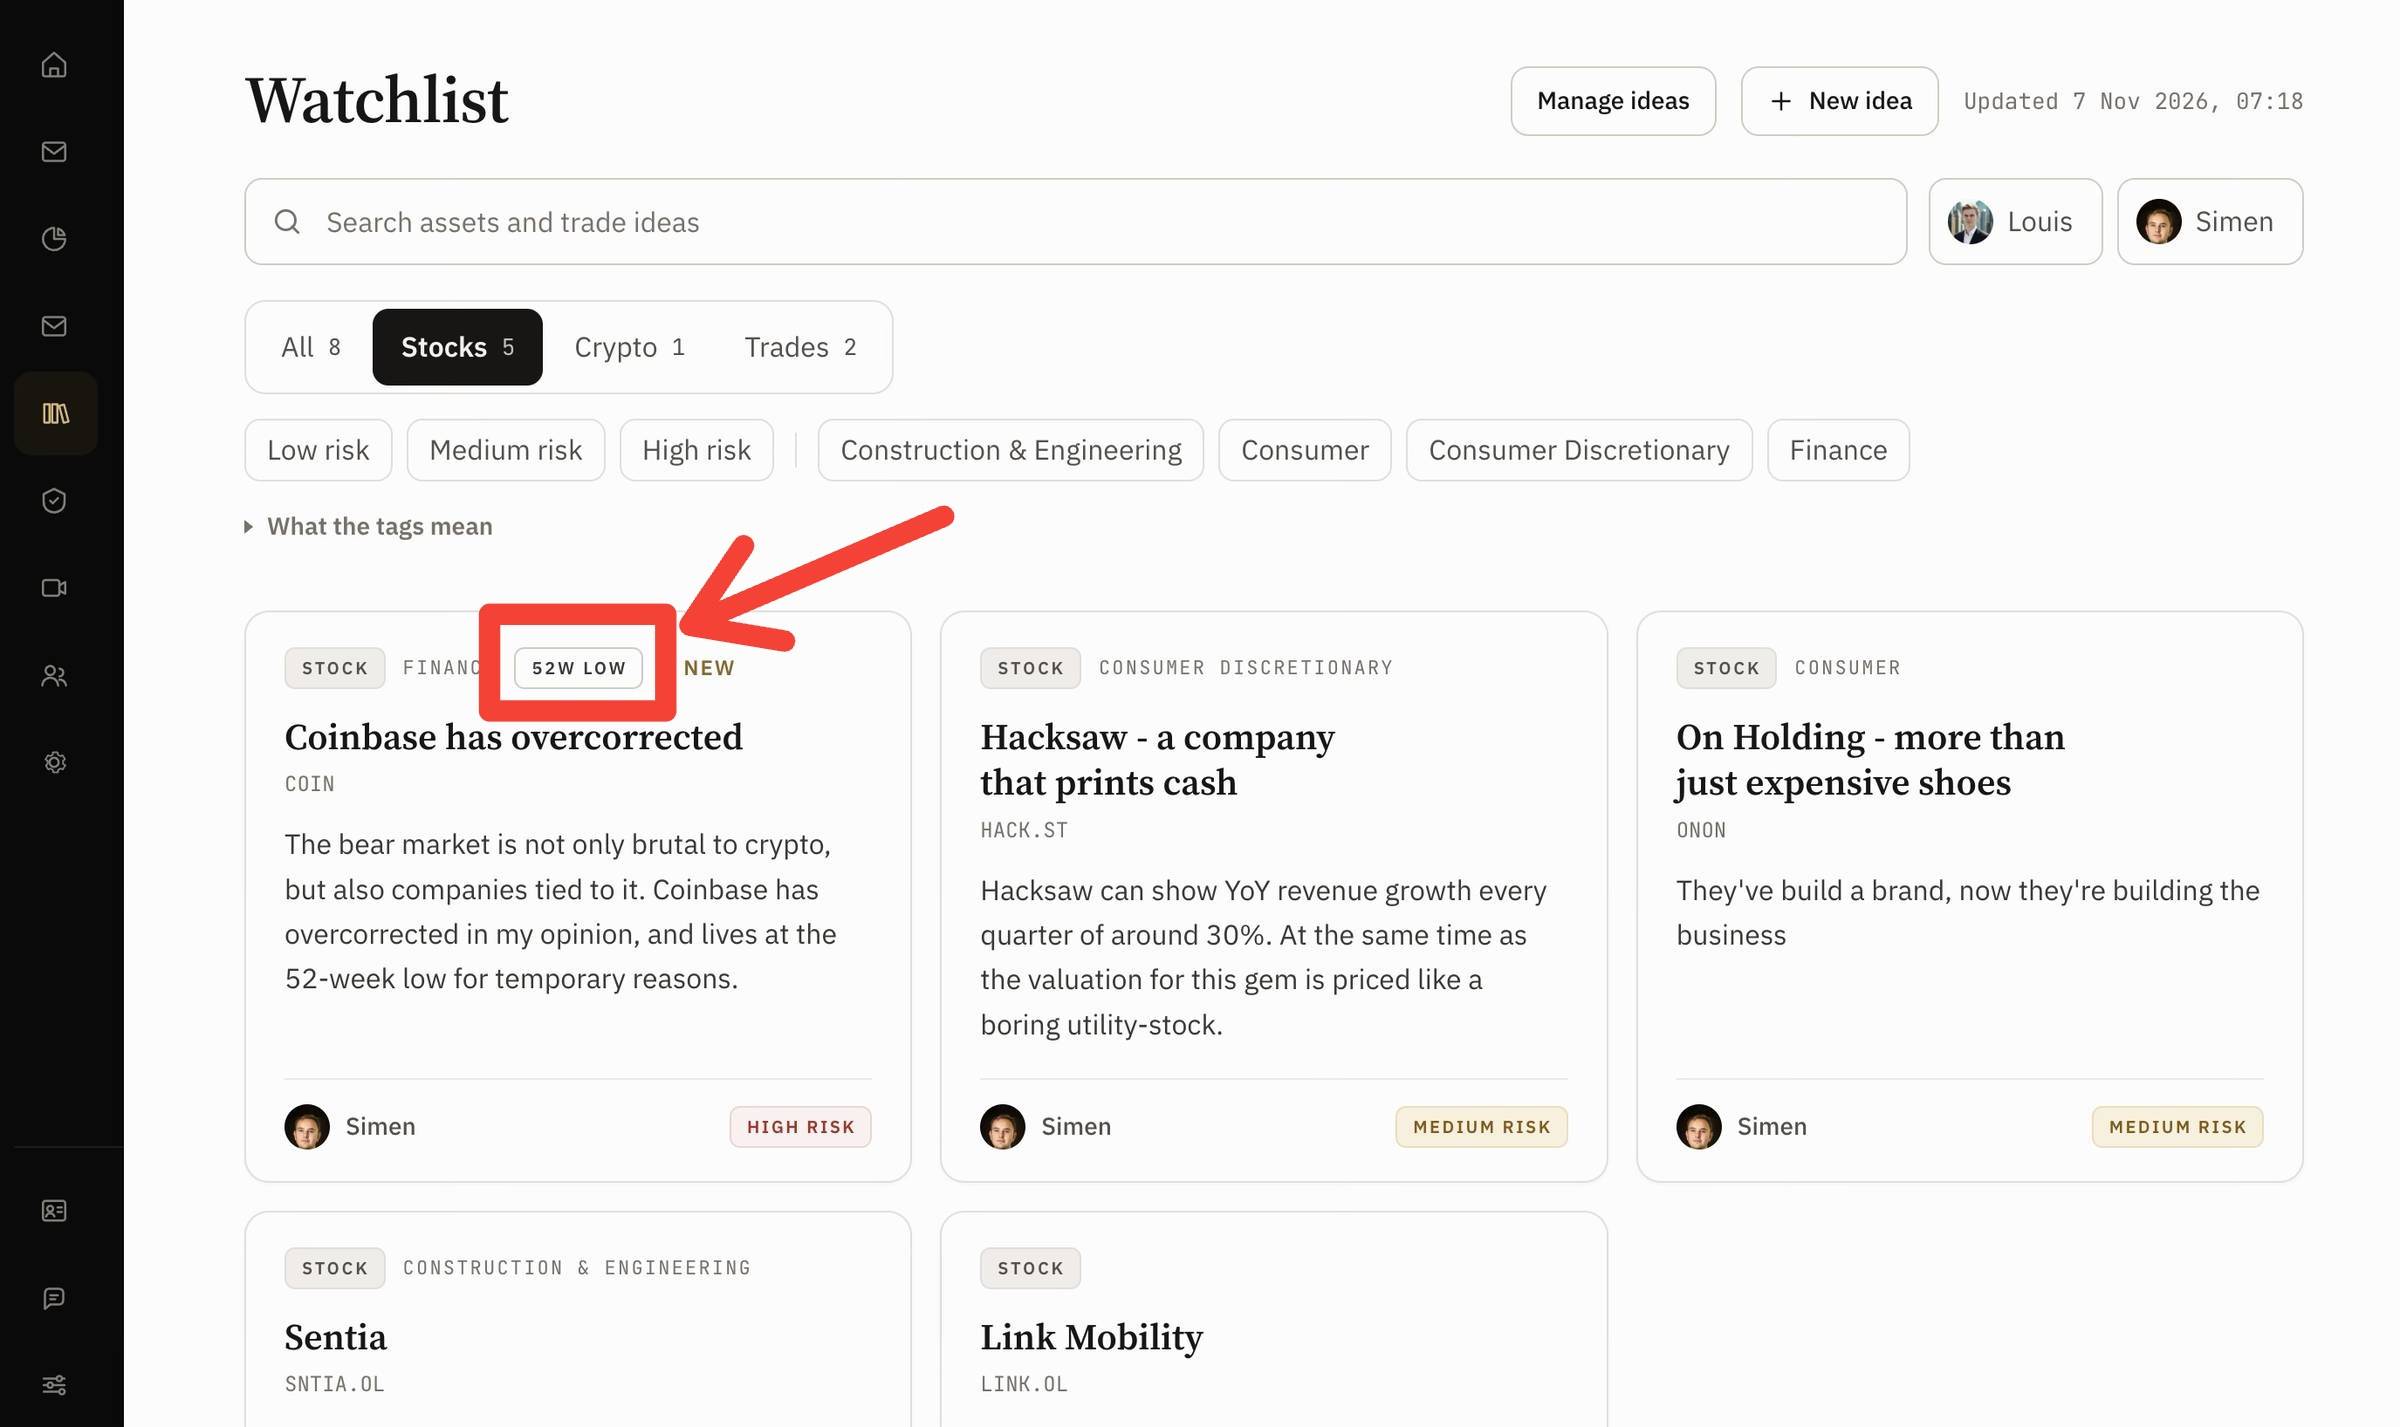
We're building a watchlist in the Terminal, where you'll see some companies on the watchlist marked 52-Week Low.
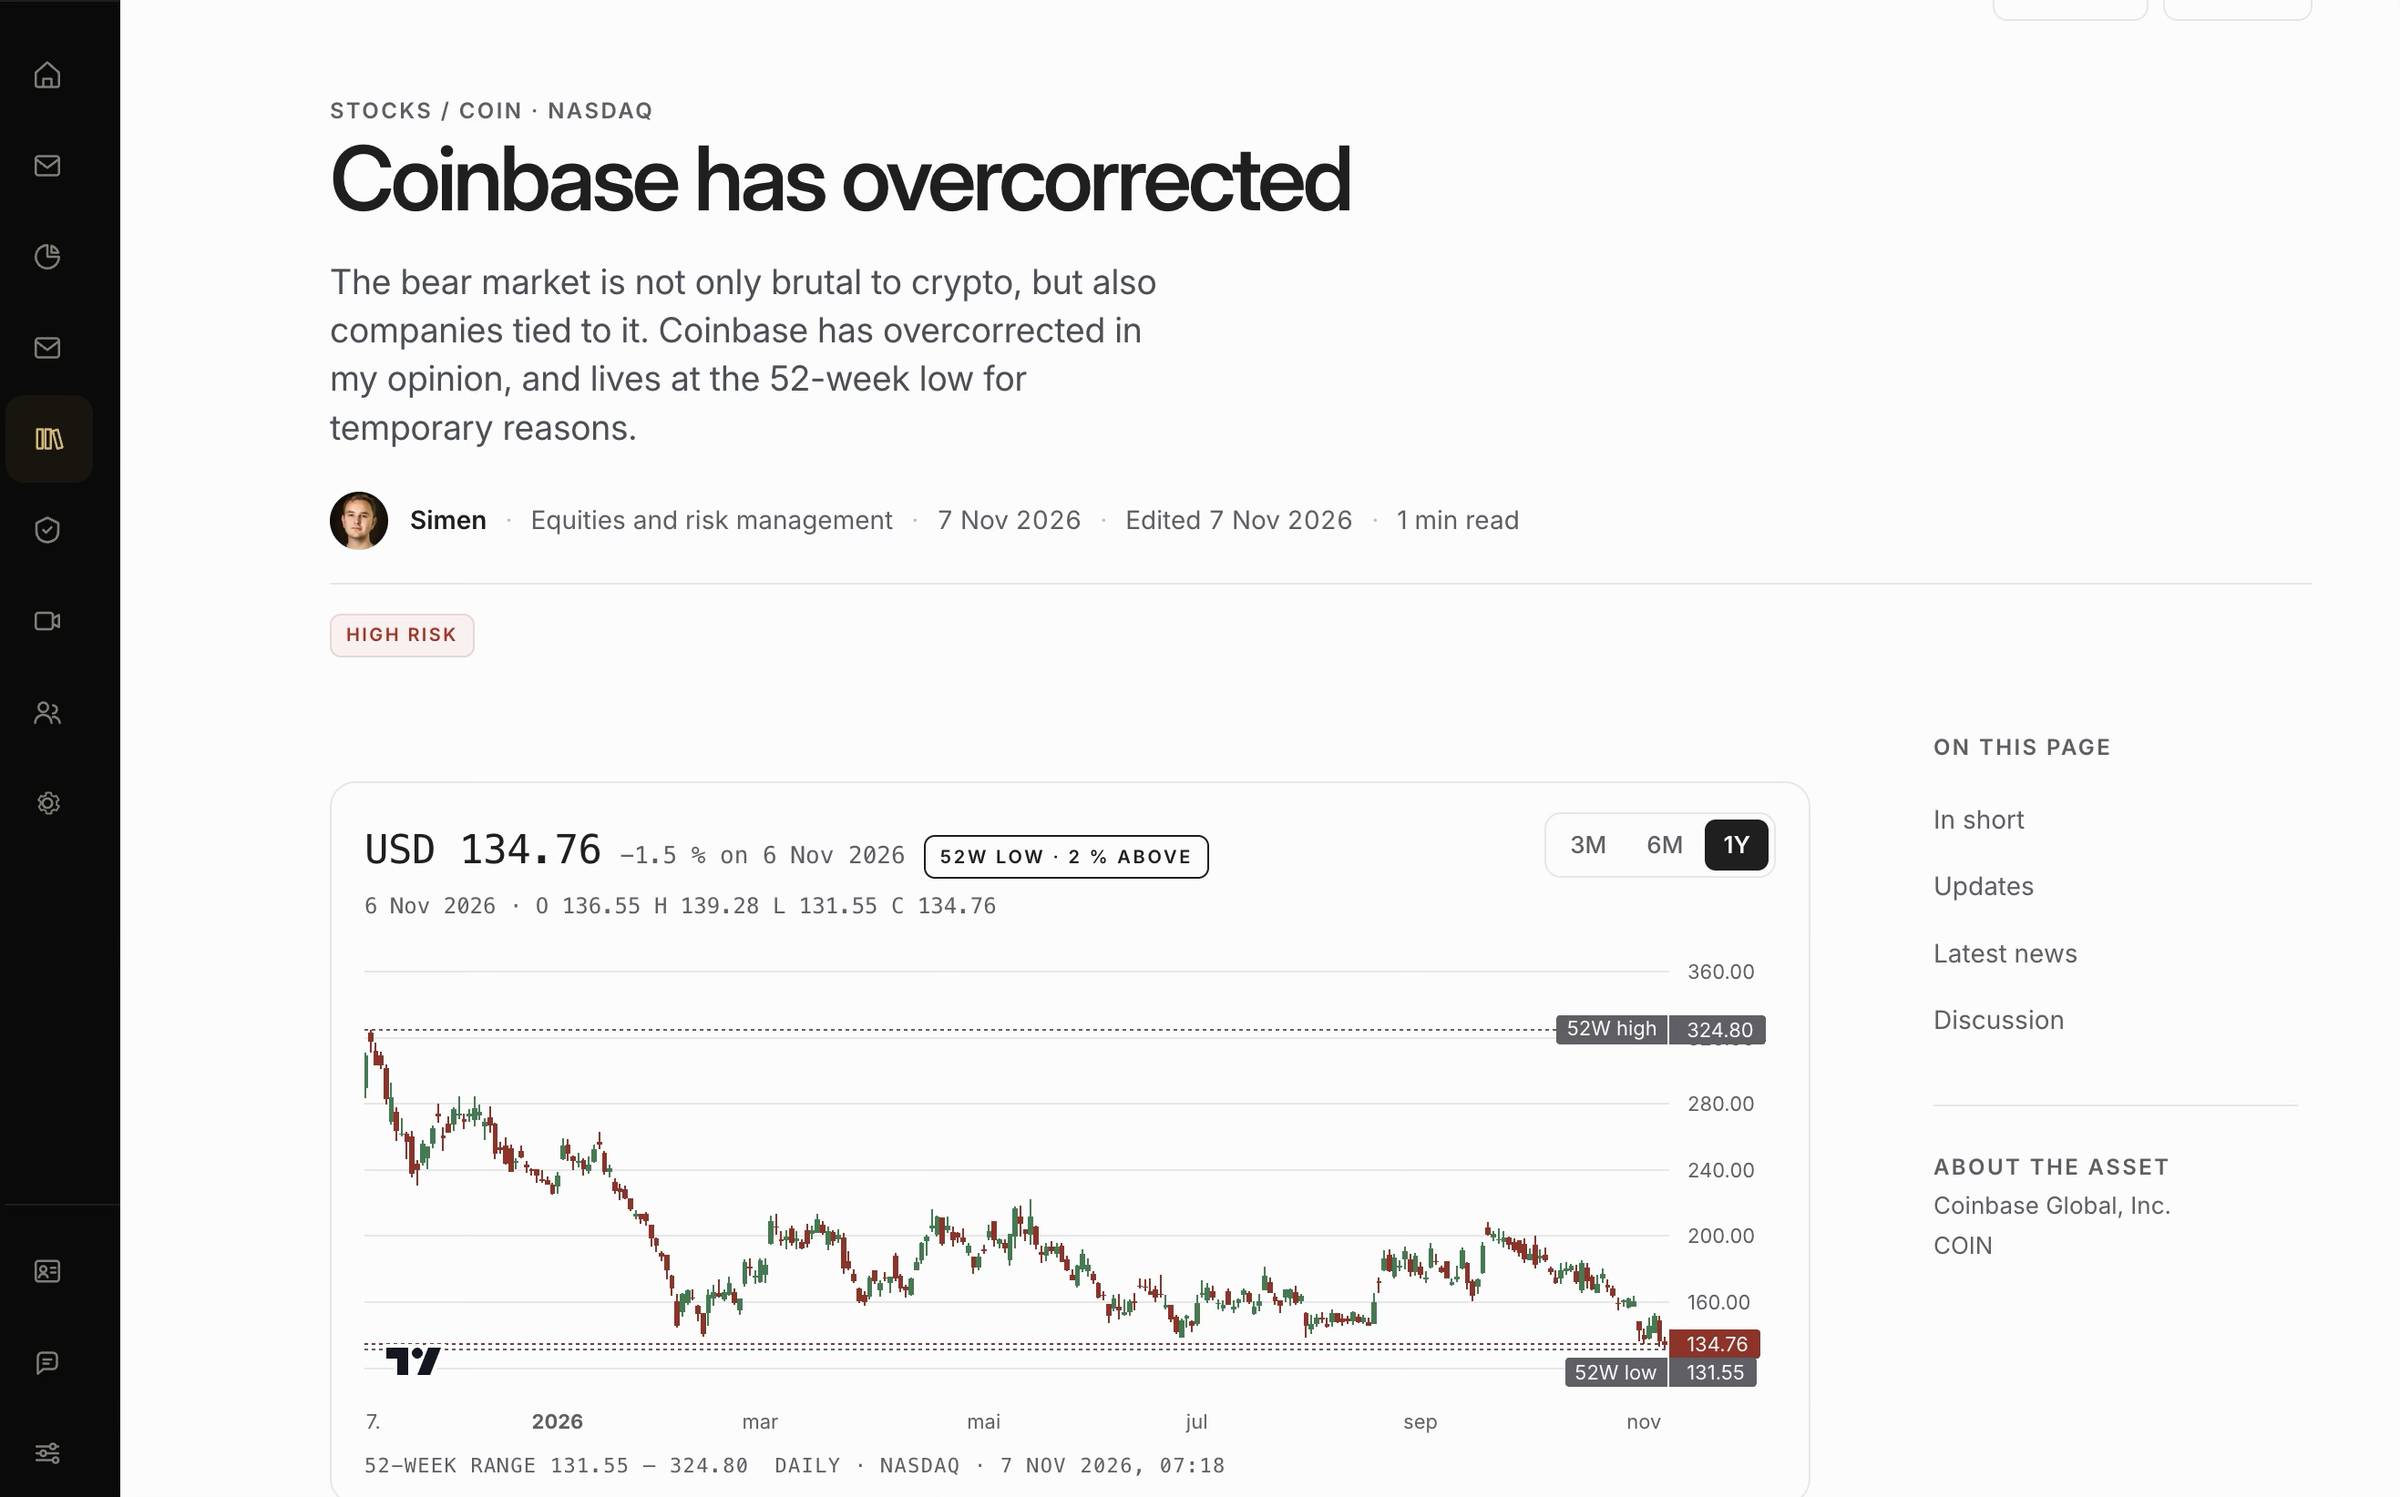
In the screenshot below you can see how it looks. Coinbase carries the label right now. On Holding and Hacksaw sit on the same list without it, because they didn't come to me that way.
Each asset on the watchlist has my full analysis, and gets updated continually after important news or reports.
You'll also see a price chart, showing the 52-week range. The Coinbase page below shows the full year, with the 52-week high and low marked and the current price about 2% above the low.
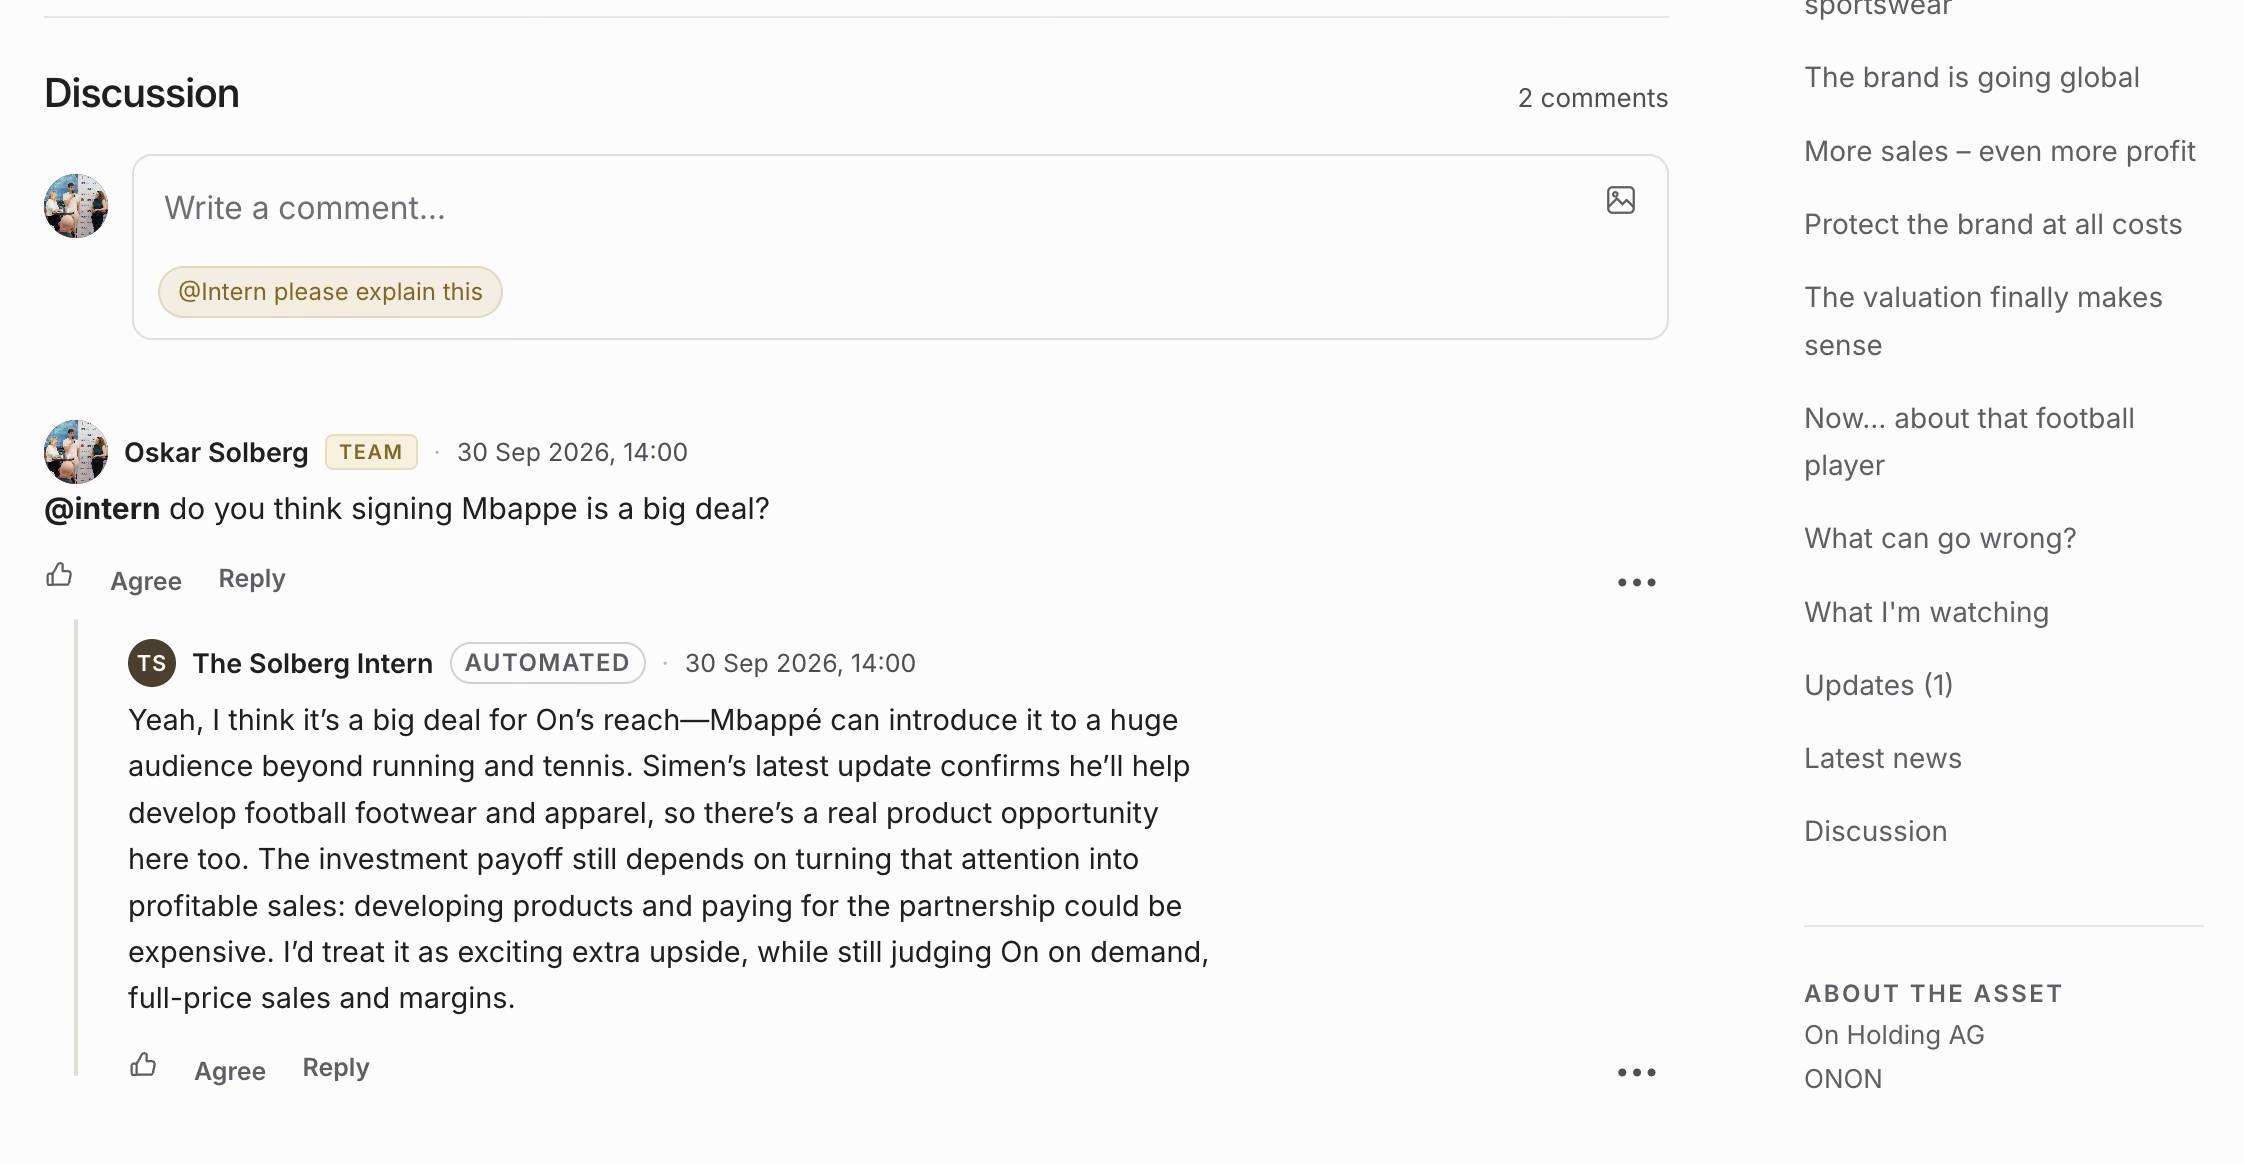
We've added key metrics and latest news on each asset as well, and a discussion area where you can ask questions.
Oskar built an AI agent of course... which you can ask questions in the discussion section. The last screenshot shows him asking the Intern whether the Mbappé signing is a big deal for On.
We're opening the Terminal this month.
And to be clear, the 52-week mark doesn't mean these companies face a lower bar for inclusion.
Quite the opposite.
They go through the same fundamental analysis as our other investment cases. The same four checks you just read about.
The label simply tells you how the company first appeared on my radar.
The share price fell far enough for me to ask whether the market's pessimism was justified.
Where this leaves you
Understand... there's no shortage of stocks that have fallen 30%, 40% or 50%.
The hard part is finding the few where the underlying business hasn't followed the share price down.
I'd much rather find three genuinely interesting companies than fill a watchlist with ten stocks just because their charts look cheap.
I use different tools to find the candidates. The fundamental analysis decides what I think is worth buying.
Here is the order I actually follow:
The 52-week low is where you start asking. The business, financials and outlook tell you whether the drop is justified. The valuation tells you whether it's worth your money even if it isn't.
Often, the pessimism is justified. Lululemon is cheap by the metrics and getting cheaper for a reason, and I want no part of it.
But every now and then, I find a company where the share price has become significantly weaker without the business becoming equally weaker.
On Holding was one. Up 23% from the letter as I write this, after peaking above 40%, with the business doing what management said it would.
You do not want to own stocks in a bad company, even if the p/e is low.
You need an overreaction to a temporary factor, with strong underlying fundamentals.