
Most Ethereum price predictions range from 2000$ all the way up to 20 000$. The problem is that data and sound logic do not drive them. They stick their finger in the air and make an “educated guess”.
That’s not the way we do it.
We look at the historical data, and use models to see what assumptions logically follow. We base our predictions on real stuff, making them useful and likely to be accurate.
The predicted Ethereum price for 2021 is $8000. This is based on the fundamental on-chain metrics of Ethereum, together with technical patterns in the price charts of ETH / USD and ETH / BTC. In addition, the Bitcoin dominance, and BTC / USD charts predict an Ethereum price of $8000.
I’m going to take you on a journey in this article. You’ll not only be left with a price prediction, but also a new, more analytical way of thinking about them.
I’ll give you a solid method to make price predictions on Ethereum and all the major alt-coins.
We’re going to look at:
I have another article that shows my personal Ethereum investing and trading strategy and how you can make higher returns. I think you might like it: Read it now.
How I Predict the Price of Ethereum
One of the key elements in our Ethereum price prediction is the Ethereum dominance. You’ve probably heard about Bitcoin dominance, which is the percentage of the total market cap of cryptocurrencies that Bitcoin holds.
Check out the BTC dominance and total crypto market cap here
In other words, if all cryptocurrencies combined have a market cap of one trillion USD, and Bitcoin has a market cap of 650 billion USD, the Bitcoin dominance is 65% because 650 billion is 65% of one trillion.
Ethereum dominance is the same thing. It’s the percentage of the total market cap of cryptocurrencies that is in Ethereum.
Now, how can we use this metric to make a price prediction?
The way I make all my alt-coin price predictions is first to predict the combined crypto market cap and the dominance of that specific alt-coin.
Let’s look at a practical example:
If the combined market cap hits one trillion dollars, and Ethereum dominance is 10%, we know that the Ethereum market cap is 100 billion dollars.
All we have to do now is to divide the market cap by the supply (number of coins in circulation). This leaves us with a dollar price per ETH.
In summary, my strategy for predicting the price of Ethereum and other altcoins is first to predict the combined market cap of all cryptocurrencies and then the dominance of the given alt-coin.
For this strategy, we therefore need two things:
Predicting the Total Market Cap of Cryptocurrencies
Predicting the combined market cap of cryptocurrencies might sound scary, but it’s not that bad. As long as we start with Bitcoin, and remember this:
The best way to predict the total market cap is to make a Bitcoin price prediction and predict the bitcoin dominance.
Bitcoin Price and Dominance Prediction
I believe that Bitcoin will reach at least 100 thousand dollars within a few years. I’m not going into detail on it in this article, as this is an Ethereum price prediction.
The grounds on which my prediction stands are:
Want to know more about bitcoin reaching 100k?
Read this: Realistic Bitcoin Price Prediction 2021
Now that we have a prediction of Bitcoin reaching 100k, we need to predict the Bitcoin dominance:
The Bitcoin dominance is usually high in bear markets, and lower in bull markets. This is great for those of us that hold Ethereum. Let’s look at how the Bitcoin dominance has behaved in the past and try to predict the future:
Below you see a chart showing the Bitcoin dominance. On the right vertical axis, you see the percentage that Bitcoin holds.
Notice how it trends downwards in 2017 (bull-market), upwards from 2018 to the summer of 2019 (bear-market), and has started a down-trend again?
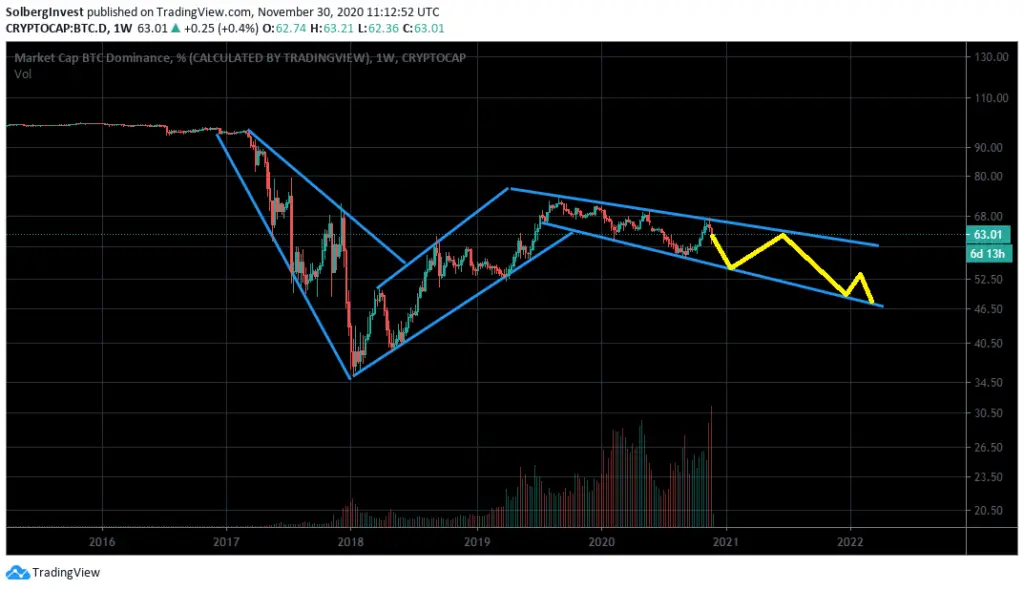
General trends are within the blue lines, and the yellow line is a possible future.
The exact value of the yellow line is not important; the point I’m trying to make is that it’s trending downwards, meaning that alt-coins are gaining on Bitcoin.
The Bitcoin dominance went all the way down to 35% in 2017. It’ll probably go just as low this time, but that’s pure speculation and hard to predict.
According to the trend lines (blue lines), we’ll see a Bitcoin dominance of around 50% at the end of 2021/the start of 2022. Most of the Bitcoin data seems to indicate that this is where we’ll see a 100k Bitcoin as well.
Conclusion:
The data seems to suggest that we’ll see a Bitcoin price of 100 000 USD, with a Bitcoin dominance of 50% at the end of 2021/beginning of 2022.
PS:
I have a free newsletter where I send out technical analyses on Bitcoin, Ethereum, Cardano, and others. Also, you’ll get some free guides and reviews. Sign up for free below:
Suggested reading:
Calculating the Total Crypto Market Cap:
Now we got all we need to run the calculation. We got a Bitcoin price of 100k, a dominance of 50%, and a circulating supply of 18 800 000 coins (18.5 million + inflation of ca. 2%).
The total market cap of cryptocurrencies will be the market cap of Bitcoin (price * supply) times 2 (Bitcoin dominance of 50%):
100 000 USD * 18 800 000 * 2 = 3 760 000 000 000 USD (3.76 trillion USD)
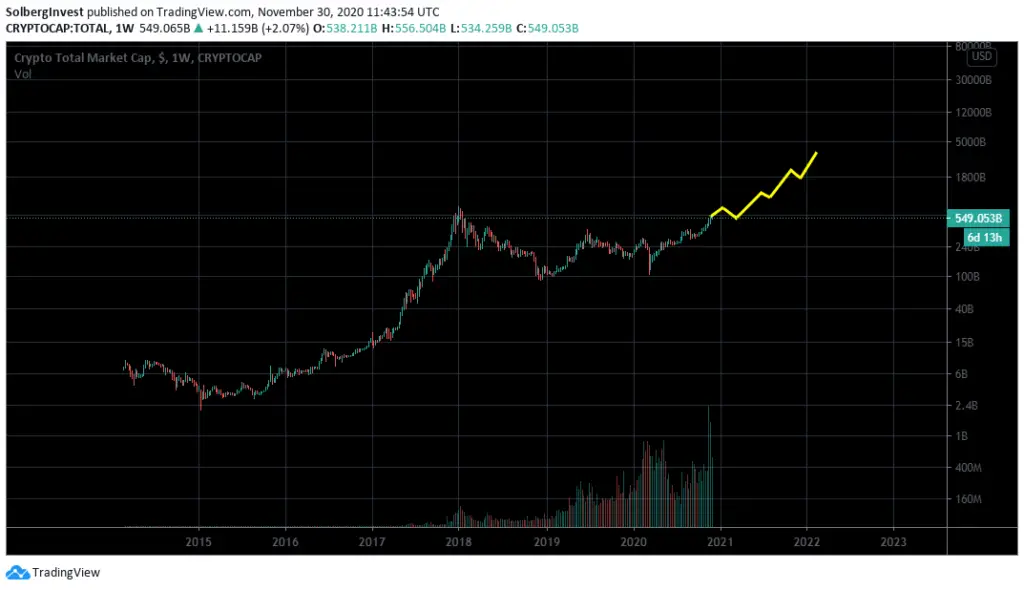
Below you see a chart showing the total crypto market cap, with a yellow line showing what our prediction might look like.
Again, the yellow line is not to be taken too seriously; it’s just a possible outcome. The point is to illustrate what the general trend would look like:
Predicting the Price of Ethereum
Finally, we have everything we need to make our Ethereum price prediction. All we need to do now is to predict the dominance of Ethereum at the peak of the next cycle and multiply that percentage with the total market cap.
Let’s look at what the Ethereum dominance has been in the past to see if we might find some general trends and patterns:
We see a solid trend reversal at the end of 2019. The Ethereum dominance is moving up again.
It looks like the opposite of the Bitcoin dominance chart you saw earlier. It trends up in the bull markets and down in the bear market.
It seems like there is a channel in which the dominance increases. Should this channel hold, we can predict a 20-28% dominance at the peak of this cycle, end of 2021/beginning of 2022.
Ethereum Price Prediction at 24% Ethereum Dominance
With a circulating supply of 118 180 000 coins and a market cap of 24% of 3.76 trillion, we can do the following calculation:
3 760 000 000 000 USD * 0.24 / 118 180 000 ETH = 7 635 USD/ETH
With a total market cap of 3.76 trillion USD, an Ethereum dominance of 24%, and a circulating supply of 118.18 million ETH, we end up with a price per ETH at 7635 dollars.
Let’s run the same calculations, but change the Ethereum dominance to the most conservative number (20%) and to the most bullish (28%) we can derive from our prediction:
Bullish Ethereum Price Prediction
Let’s run the numbers with a dominance of 28%:
3 760 000 000 000 USD * 0.28 / 118 180 000 ETH = 8 900 USD/ETH
If we reach the top of the dominance channel at the peak of this cycle, we’ll see an Ethereum price close to nine thousand dollars.
Conservative Ethereum Price Prediction
Let’s run the numbers with a dominance of 20%:
3 760 000 000 000 USD * 0.20 / 118 180 000 ETH = 6 363 USD/ETH
If we reach the bottom of the dominance channel at the peak of this cycle, we’ll see an Ethereum price close to 6 500 dollars.
The Fundamentals of Ethereum – Icing On The Cake
So far in our Ethereum price prediction we’ve only been looking at historical data. In most cases this is the best way to go about it, but in Ethereums case it’s not:
There’s way too much bullish stuff going on with Ethereum not to consider it when predicting the future price.
Ethereum On-Chain Metrics
There are lots of on-chain indicators we can look at to gauge how Ethereum is doing on a fundamental level:
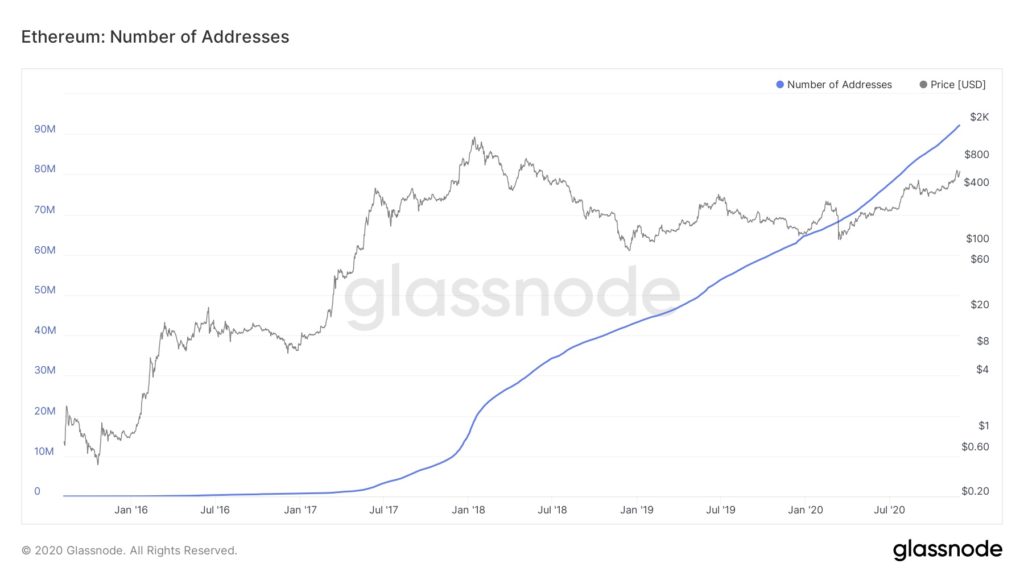
The total number of Ethereum addresses (source: glassnode.com):
Tells us how many Ethereum wallets there are.
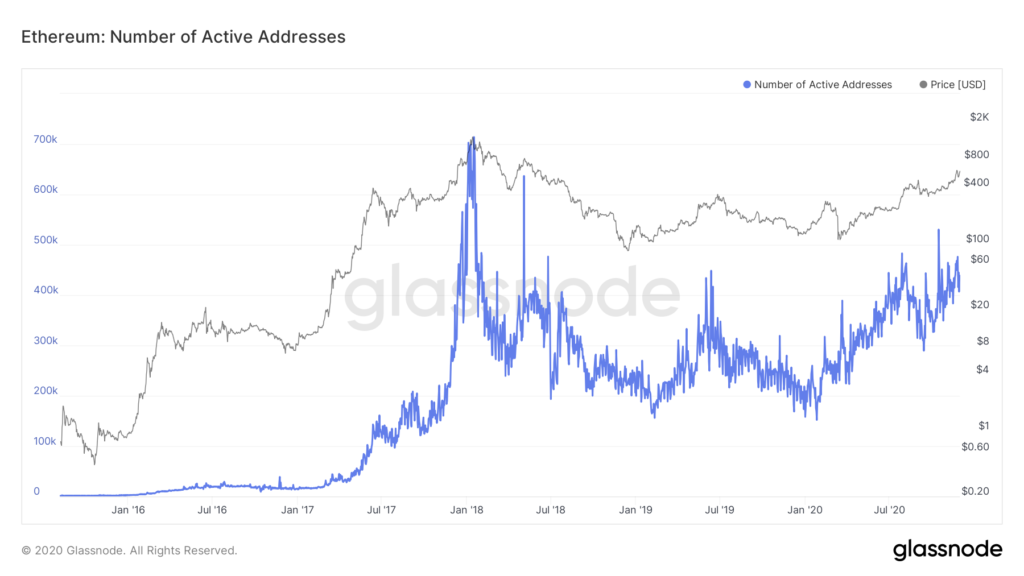
The number of active Ethereum addresses (source: glassnode.com):
Tells us how many people are using/trading Ethereum.
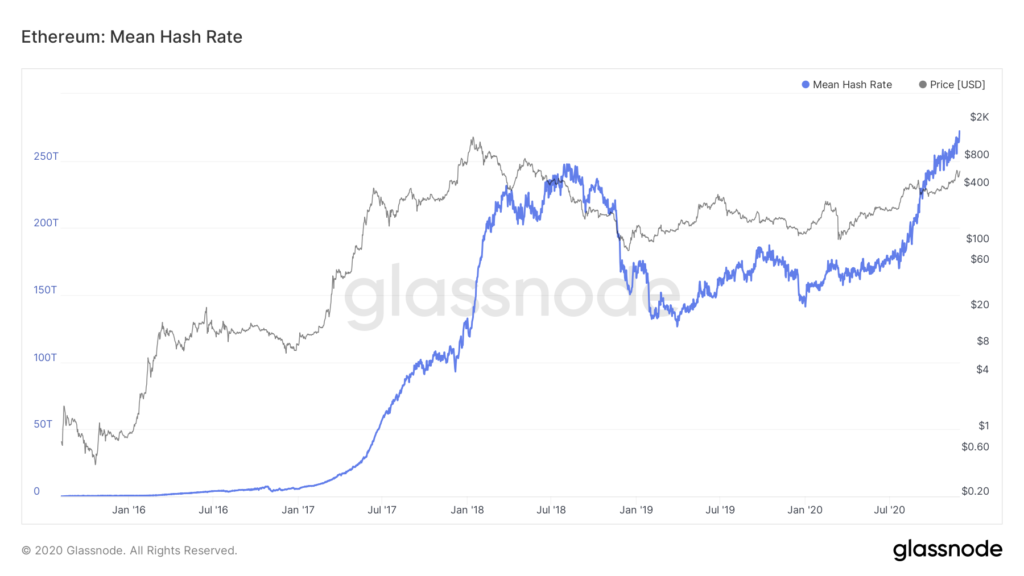
The hash rate of the Ethereum network (source: glassnode.com):
Tells us how much computing power is working to secure the network.
Ethereum 2.0
Ethereum 2.0 will bring a lot of change to the Ethereum network. There are two changes we’re going to take into consideration in this article:
Staking
Staking basically means locking it up and receive interest on it. If you want a more detailed explanation about it, read this article.
When you lock your Ethereum for a certain amount of time, you help secure the network and receive ETH as a reward. It’s like crypto mining, without the insane electricity bill or the expensive equipment.
Staking will cause many people, including myself, to lock their Ethereum up and receive interest at ca. 4-6% p.a.
This effectively decreases the number of Ethereum in circulation, and therefore the number of Ethereum being sold/traded.
It will shift the supply vs. demand balance and cause the price to increase.
Scalability
Currently, Ethereum can handle 15 transactions per second. That’s not all that impressive, and acts as a bottleneck when the traffic is high. This increases the fees for using the Ethereum blockchain, as well as slows it down.
Read about Ethereum 2.0 here
Ethereum 2.0 will eventually be able to handle up to one million transactions per second.
However, the upgrade will not happen overnight, but step-by-step over a few years.
We’ll probably see a few thousand transactions per second over the next couple of years, which is more than enough to handle the current demand.
This will improve Ethereum both in its capacity to handle traffic and lower the fees for using it. It’s a huge deal, and it’s finally happening. Phase zero will launch in December of 2020, kick-starting the move to Ethereum 2.0
Conclusion: My Ethereum Prediction is $8000
The historical data suggest an Ethereum price in the range between 6500 – 9000 USD. We got this prediction by taking the total market cap of cryptocurrencies multiplied by the Ethereum dominance and dividing that number with the circulating supply.
The on-chain metrics, the total number of addresses, active addresses, and hash rate are also increasing. They all indicate a bullish future for Ethereum.
Ethereum 2.0 is finally beginning to launch. This will bring staking and scalability. Staking will effectively decrease the circulating supply of Ethereum, causing the price to increase.
The scalability will improve the Ethereum network significantly, taking the transactions per second from 15 to a few thousand and eventually (hopefully) to one million.
Ethereum is, without a doubt, extremely bullish. The historical data and the fundamentals seem to indicate an Ethereum price far beyond anything we’ve seen so far.
The conclusion of our analysis is this:
Ethereum will reach 6500 – 8900 USD at the peak of this cycle. The fundamentals indicate that we’ll end up in the upper part of that range.
Therefore, the predicted price of Ethereum based on models, historical data, technical analysis and on-chain metrics is 8000 USD.
Do You Invest in Crypto?
I send regular updates on all the most important metrics, and technical analyses on Bitcoin and Ethereum.
Also, I write about LINK and ADA, as well as the Bitcoin Dominance.
You also get my free guide with four easy ways to increase ROI.
Click the button below to sign up, and claim my free guide: