There are good ways and bad ways to answer the question “is Bitcoin a good investment?”. Some say it’s going to crash, some say it’s going to the moon. Some even call it a Ponzi scheme…
None of these answers helps you in any way. That’s why I’m going to take a more analytical approach.
We’ll look at Data science models, and discuss the different factors relevant to the question. This is the best way, in my opinion, to answer the question of Bitcoin being a good investment or not.
We’re going to look at:
Is Bitcoin Investing to Risky?
There’s two ways to view the risk of investing in Bitcoin, and we’ll look at them both.
The first one looks at the volatility of the asset. The other one looks at potential downside / upside and how profitable the asset has been in the past.
Risk of Investing in Bitcoin – View #1
The risk depends on the volatility
This view assumes that high volatility equals high risk.
This is true in some instances, and not in others. This assumption holds true whenever the timeframe of the investment is short, in my opinion.
If you’re going to put money into something, knowing that in one year you have to pull it out, high volatility poses a great risk.
The stock market has relatively low volatility, and therefore according to this view, poses a low risk. Bitcoin on the other hand, has extreme volatility, and therefore according to this view, poses high risk.
How the length of the investment influence the risk associated with it:
In the short term, there’s a lot of noise. The price movements on a daily basis is hard, if not impossible, to predict. The short term is irrational.
Therefore, short-term investments are prey to the irrational day-to-day price movements of the given asset. Higher volatility means higher day-to-day price swings, both up and down, which in turn gives the investment a high risk.
However, the long-term picture is different:
When you zoom out, and look at the longer time-frames, you block out a lot of the short term noise. You’re vison is no longer polluted by the irrational short-term swings. Long-term price movements are often more rational and predictable.
Therefore, Investments with a long timeframe are no longer prey to the irrational short-term, and therefore less risky.
This is why I think the assumption that volatility equals risk is true in the short term, but false in the long-term. The long-term cancels out the day-to-day noise, and therefore a lot of the risk associated with the volatility.
Risk of Investing in Bitcoin – Veiw #2
Historical profitability, logarithmic regression growth curves and Stock to flow:
The second view looks at the historical profitability of the asset, and uses data science to model the future price. This view is the best one in my opinion, at least when taking about Bitcoin.
Historical Profitability of Bitcoin
Bitcoin has historically been extremely profitable. Below you see a model showing you the number of days you could’ve invested, and be “in the money” or at break even. The green data points represent profitable days, the red data points represent unprofitable days. (Source: lookintobitcoin.com)
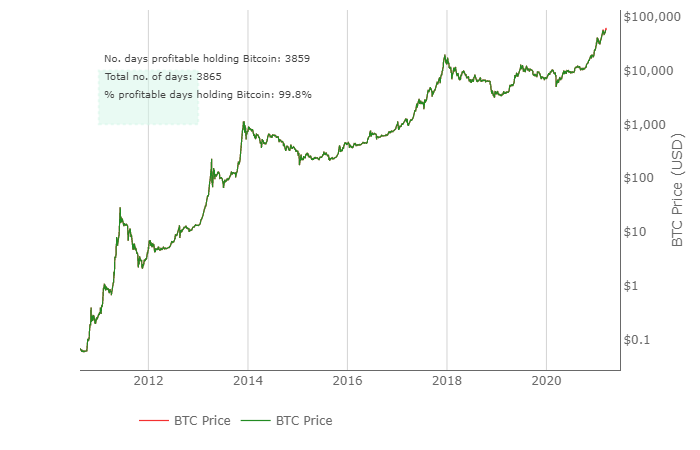
It’s important to note that this view assumes that historical data can help us predict the future.
Although this has been the case up until now, it’s not guaranteed to continue beeing the case in the future. For all we know historical data might be useless at some point in the future. Maby even now.
Bitcoin Logarithmic Growth Curves
Below you see another popular model showing the Bitcoin price ranging within a logarithmic band.
The band seems to work as support/resistance for the Bitcoin price. The price-peaks stop at the top of the band, and the price-crashes stops at the bottom of the band.
It’s important to remember that the band is just imaginary lines drawn by a human being, but they do seem to predict the price of bitcoin fairly well. (Source: Lookintobitcoin.com)
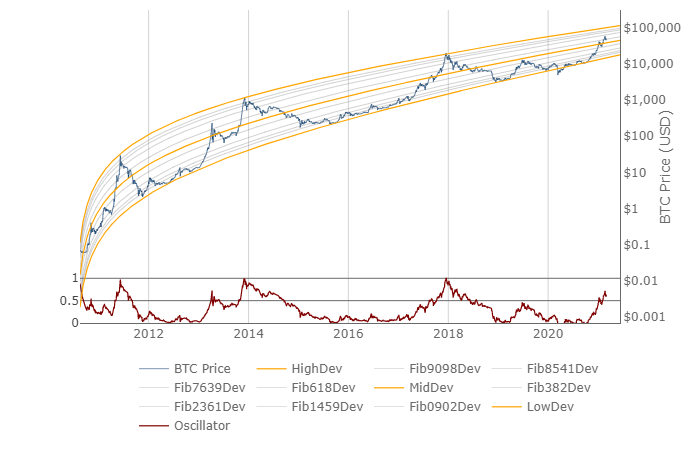
This is a logarithmic chart, meaning every step up on the price (right vertical axis) is a 10x. Even if it looks like the price is increasing at a slower rate, it’s actually accelerating, at least in terms of USD per BTC.
This model also assumes that the past helps us predict the future. As previously stated this has been the case untill now, but is not guaranteed to continue.
It does seem to indicate that Bitcoin is a good investment in 2021. Especially combined with the historical profitability model, and the other models and price indicators we’re going to look at.
Suggested reading: Can Bitcoin Reach $1 Million USD?
Bitcoin “Stock to Flow” Model
The last model I’d like to show you has to do with the “stock to flow” (S2F) of Bitcoin. The S2F tells us how many years it would take to produce the existing supply of Bitcoin at the current production rate of Bitcoin.
In other words, a S2F of 10 means it would take 10 years to double the supply of Bitcoin.
Again, the production in this case, is the newly mined Bitcoin. The supply is all the Bitcoin currently in circulation.
The S2F is important because it tells us how likely it is that the given asset experiences a stark increase in supply, which would drive the price of the asset down.
In Bitcoins case, a supply shock is impossible, because the production rate is pre-determined in the code, and cut in half every four years due to “the halvening“.
When the production rate of Bitcoin is cut in half, the S2F is doubled. This happens every four years. A higher S2F should lead to a higher, more stable price.
Below you see the S2F model made by PlanB. This shows you the predicted price at any given S2F. The coulorful dots are the price of Bitcoin, and the lines are the S2F of Bitcoin over time. Every four years the line climbs due to the halving, pushing the price up to new highs. (Source: lookintobitcoin.com)
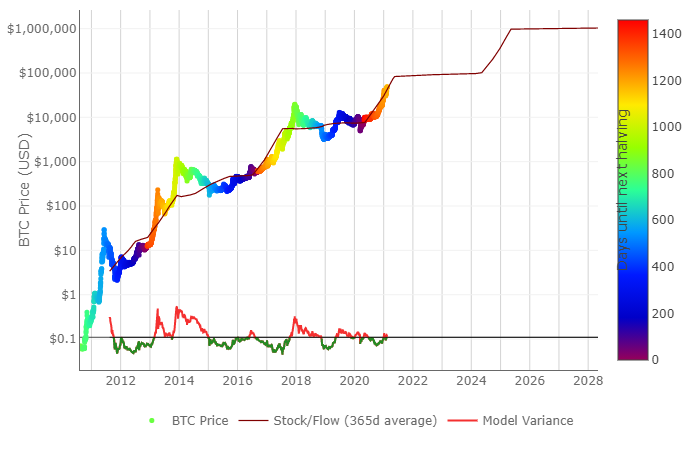
Again, the metrics increase exponentially. Ever tick up on the price (left vertical axis) is a 10x. The line that the price clings to, representing the S2F of Bitcoin, doubles every four years. This is, again, because of the logarithmic nature of the chart.
For instance, the S2F in 2017 was 27, and the predicted price at that S2F level was in the 5-10 thousand dollar range. It surpassed this prediction, climbing all the way up to 20 thousand USD.
We had a halvening in May of 2020, cutting the production rate in half, and therefore doubling the stock to flow over the next year or two. The predicted price when the new S2F of 54 kicks in is around 100 000 USD, further strengthening the prediction of a six figure Bitcoin.
Risk of Investing in Bitcoin – Concusion
Regardless of my personal bias and price-predictions, it’s clear as day that these models indicates that the risk of investing in bitcoin is currently extremely low. The historical profitability is absurdly high, we’re in the bottom part of the logarithmic band, indicating a cheap Bitcoin price, and the S2F is about to double.
Both the Logarithmic Growth Curve model and the Stock to Flow model predicts a Bitcoin price above six figures. However, there’s one more thing I’d like to show you that supports the 100k price prediction:
The ROI of Bitcoin cycles have shown to be 1/3 of the previous cycle. The cycle before the last one had approximately a 333x from bottom to top. The second had 100x from bottom to top. Should this pattern continue we’ll see a 33x from bottom to top in this cycle.
Now, what Bitcoin price would we get from a 33x from the bottom?
The bottom of this cycle was around 3300 USD. A 33x would put us right around 100k per Bitcoin.
The combination of a price prediction about ten times higher than the current price, as well as indicting that Bitcoin is cheap right now is extremely bullish. Slap on the fact that 99.1% of days ever has been profitable, and your left with one possible conclusion:
Bitcoin is a good, if not the best, investment to make in 2021.
Using Trend Predictions to Figure out if Bitcoin is a Good Investment:
Golden / Death Cross and the 20 Week MA
Most people lick their finger and stick in in the air when making predictions about the future.
As you should know by now, that’s not the way we go about it at Solberinvest.
We look at data-science and historical data, and make assumptions based on what the it suggests. Let’s look at the two most important indicators we can derive from historical data; Golden crosses / Death crosses and the 20 week moving average:
Golden cross vs Death cross:
Before every single bull run, there’s been a “golden cross”. Equally important, before every single bear market we’ve seen a “death cross”.
A golden cross is what we call the event when the 50-day moving average crossing over the 200 day moving average.
Now, what does that mean, and why is that so bulish?
Moving Averages and Crosses
A moving average is the average closing price over a specified number of time-units (days, weeks or months usually).
The 50 day moving average is the average closing price of the last 50 days. The 200 day moving average is the average closing price of the last 200 days.
When the 50 day moving average crosses above the 200 day, we “print a golden cross”. But what does this actually mean, and why do we care?
Well, it often helps to read stuff like this out loud: “The average closing price of the last 50 days is higher than the average closing price of the last 200 days”.
Okey, that we can wrap our head around! It basically means we’re moving up at a quicker pace than we did before. The Bitcoin price is ramping up.
Death crosses are the opposite. It means that the 50 day MA (moving average) has crossed below the 200 day MA, indicating that the bear market has started.
Below you see a chart showing the Bitcoin price together with the 50-day and 200-day moving average. The yellow arrows shows the golden crosses, and the red shows the death crosses.
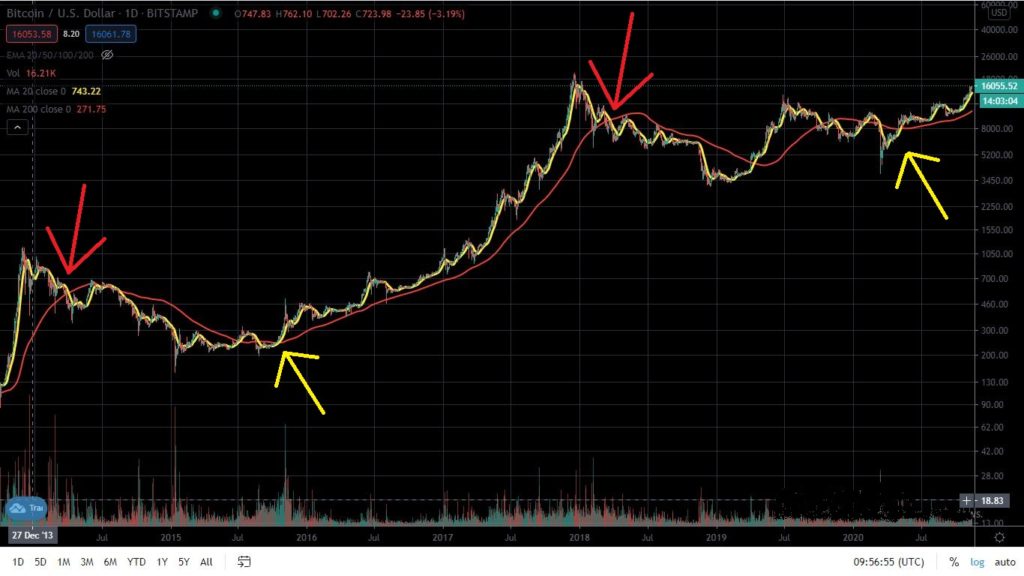
As you can see, the goldencross signals the bull run, and death crosses signal that the bear market has started. We had a golden cross in 2020, which indicates that we’ve started a new bull market.
The astute observer will notice that not all golden/death crosses have been pointed out, for instance the golden cross in the summer of 2019. I left these out because even though these golden crosses printed, nothing happens.
Well, what happened in 2019 was that the golden cross caused the market to spike up several hundred percent, but we then fell down a few months later.
Well, how do we know when to trust a goldencross?
The answer is that a golden cross is not trustworthy without looking at one more thing; the 20 week MA. The price also has to hold the 20 week MA as support.
In other words, the golden cross is necessary, but not sufficient for a bull market to kick off. We also need to hold the 20 week MA as support.
Bitcoin Holding the 20 Week MA
Holding something as support or resistance simply means that the price does not cross that price level, but bounces back when nearing it.
Holding the 20 week as support means to bounce back up from the 20 week, and not crossing below it. Holding it as a resistance means to bounce back down when nearing it, and not crossing over it.
Support is kind of like a floor, while resistance is like a ceiling.
Below you see the Bitcoin price together with a blue line representing the 20-week moving average. The 20-week moving average is the average closing price of the last 20 weeks.
Every single bull market we’ve seen has held the 20 week as support on the way up. In addition, every single bear market has held the 20 week as resistance.
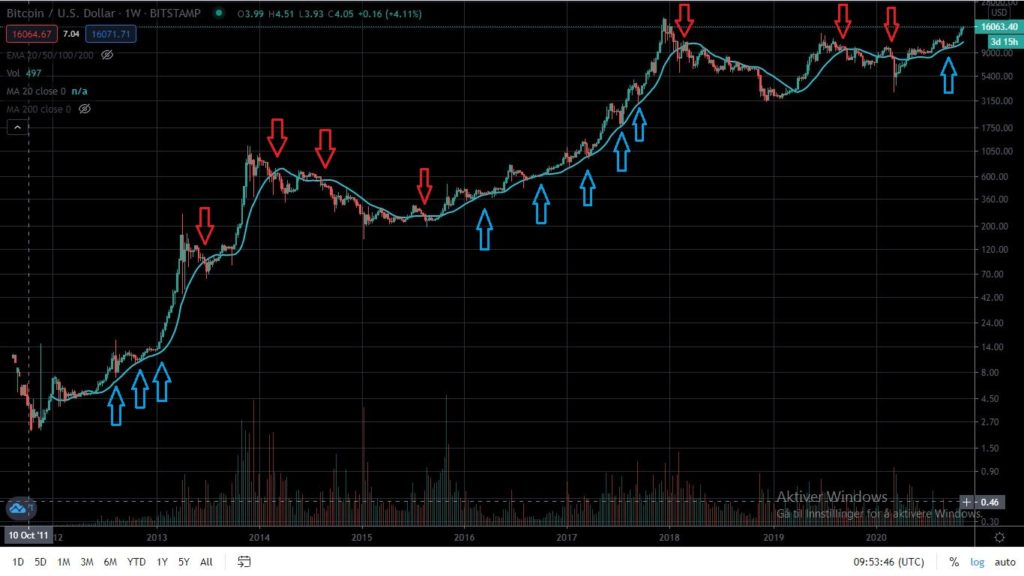
The red arrows shows where the price failed to hold the 20 week as support, and the blue arrows shows where it successfully tested the 20 week as support.
it’s clear as day that the blue arrows, meaning successful tests of the 20 week are super bullish, and the red ones are bearish.
To confirm that the bull market has started we first need a golden cross, and then to hold the 20 week moving average as support. That’s what we did the last two times we had a bull run.
Where is Bitcoin headed?
We have had out Golden cross, and we had a successful test of the 20 week moving average as support. This is mega bullish, and basically confirms that we’re in the beginning stages of a bull run.
It’s important to remember that just because something happened in the past, it doesn’t have to happen again. It may be that the price fails to hold the 20 week next time it tests it, and we enter a bearish market once again.
However, if one believes that historical data is a good indicator of future price movements, it certainly seems to be a great time to scoop up some Bitcoin.
When trying to answer the question “Is Bitcoin a good investment?” you have to check these thing out. Depending on when you’re reading this, you need to check the different moving averages, and how the price has behaved relative to them lately.
At the time of writing however, I would argue that this data indicates that Bitcoin is a one of the best investments one could make.
The Opportunity Cost of Investing in Bitcoin:
To answer the question “Is Bitcoin a good investment?”, we have to take into account the missed opportunities of placing our capital in other investment vehicles like stocks, real estate or gold.
If you want to look at the opportunity cost of investing in Bitcoin we need a timeframe, as well as some assumptions about the other opportunities we’re going to compare it to.
The most popular comparison is the stock market, and that’s what we’ll be looking at here.
I’ll give you the short answer in this article, but I’ve written in length on it in another article “Bitcoin vs Stocks“.
If we assume a 7% return per year on the invested capital, as well as a timeframe of 3 years, we see that the total return will be 22.5%. The opportunity cost of investing in Bitcoin is therefore 7% per year, and 22.5% over three years.
Lets say you’ve got 10 grand to invest. The question you need to ask yourself then is “would I pay 700 USD (7% of 10 grand) per year to invest in Bitcoin?“
To figure out the total opportunity cost over the timeframe of three years, you need to multiply your capital by 1.07 (yearly return) to the power of the amount of years you’re going to hold Bitcoin.
For instance, if you have a timeframe of 10 years and a capital of 10 grand, the equation looks like this:
10 000 * 1.07^10 = 19 671.
Then you subtract the initial capital (10 000 in this example) to end up with your opportunity cost:
19 671 – 10 000 = 9 671.
You should always take opportunity cost into account when considering spending money or investing in something. This also holds true for not investing in Bitcoin.
You need to consider the opportunity cost of missing a crazy Bitcoin bull market. The last bull market we saw gave us approximately a 100x from bottom to the top. The coming one will, given my price prediction, will give us an approximated 33x from bottom to top.
This turns the question from “Can I afford to invest in Bitcoin?” to “Can I afford not to invest in Bitcoin?” My opinion on this is that the opportunity cost of not investing in Bitcoin outweighs the opportunity cost of investing in it.
Is Bitcoin a Good Investment for YOU?
The data seems to suggest that generally Bitcoin is good investment, but you’re not interested in the generall answer; you want the answer to your specific situation.
At the end of the day, the only person that can answer the question “is Bitcoin a good investment?” is you.
Only you know if you can handle the emotional rollercoaster of seeing your investment go through the extreme volatility of the crypto market.
Only you know the investment goals you have, which dictates the metrics for measuring the “goodness” of an investment.
I’ve written about this in detail in this article. The answer to the questing depends on your risk-tolerance and your goals. If you want to really understand this, and answer the question in a meaningful way, I suggest you read the article.
If you’re already convinced that Bitcoin is a good investment, but don’t know how to invest, read this article. It shows you step by step how to do it, from step one to done.
If you’ve already invested in bitcoin, or other cryptocurrencies, I would recommend you check out my guide on increasing the return on your investment (ROI):
The ROI is probably the most important part of the equation when it comes to investing. Using these four ways, you can increase it by as much as 400%. I’ve done it myself, and I’m still using all four methods today. Do not miss out: