

I've been in the crypto game for a long time. Through research and plenty of trial and error, I developed the Bitcoin investing and trading strategy described in this article.
The original strategy consisted of an active trading component and a passive BTC-lending component. This article explains how I built it around my goals and risk tolerance.
What Is A Bitcoin Investing/Trading Strategy?
Before we can make a strategy, we need to figure out what it actually is. What is the nature of a Bitcoin strategy?
In its simplest form, a strategy tells you what steps you need to take to arrive at a specified target. You need to figure out where you want to end up and how to get there.
In other words:
You need a goal and actionable steps you can take to reach it.
What Is A Goal of a Bitcoin Investing/Trading Strategy?
To set a goal, we need to figure out what makes a strategy good:
Simply put, a good strategy produces higher returns than just holding Bitcoin consistently over a long time.
For example, if you manage to produce 100% returns in two months, but Bitcoin increased 150% in those same two months, the strategy fails as holding would be better.
My benchmark was whether active decisions outperformed simply holding Bitcoin over the same period.
This goal is also the right way of thinking about altcoin speculation. If you don't produce higher returns through altcoin trading than you would have done with Bitcoin, the added risk is not justified.
Based on that comparison, my goal was to produce higher returns than I would have received by simply holding Bitcoin.
What Steps I Included In My Strategy:
This is where you can get personal and customize this to fit your needs. I'll tell you what my own steps are so that you can use them as inspiration.
As I mentioned in the introduction, the original strategy had an active trading component and, at the time, a passive BTC-lending component.
The active side is described below.
The Active Part Of My Bitcoin Investing/Trading Strategy:
The active part is all about trading. Swing trading, to be specific.
Swing trading is a "slow" kind of trading, where you have a perspective of up to several years when you buy/sell.
As a swing trader, I typically accumulate coins over time, intending to sell them 3-6 months later after a significant increase in value.
I do NOT try to time the day-to-day movements or even the weekly movements in price. I focus on the monthly or even yearly trends.
I wasn't chasing frequent 10-20 percent moves; I was positioning for larger, less frequent moves.
The short term price-movements of Bitcoin are irrational and polluted by FOMO and FUD. No one can consistently predict the short term.
The long term is different. It's much more rational and predictable. The long-term movements cancel out a lot of the short-term noise, making it easier to trade.
"Yeah, sure... But how do you do it?"
The following section is all about how I swing trade Bitcoin:
How I Swing Trade Bitcoin:
I'm a student of Mathematics and have used my knowledge of numbers and statistics to create three different models. Two of them are particularly useful for swing traders; The Risk Model and the Fair Value S2F Model.
The Risk Model:
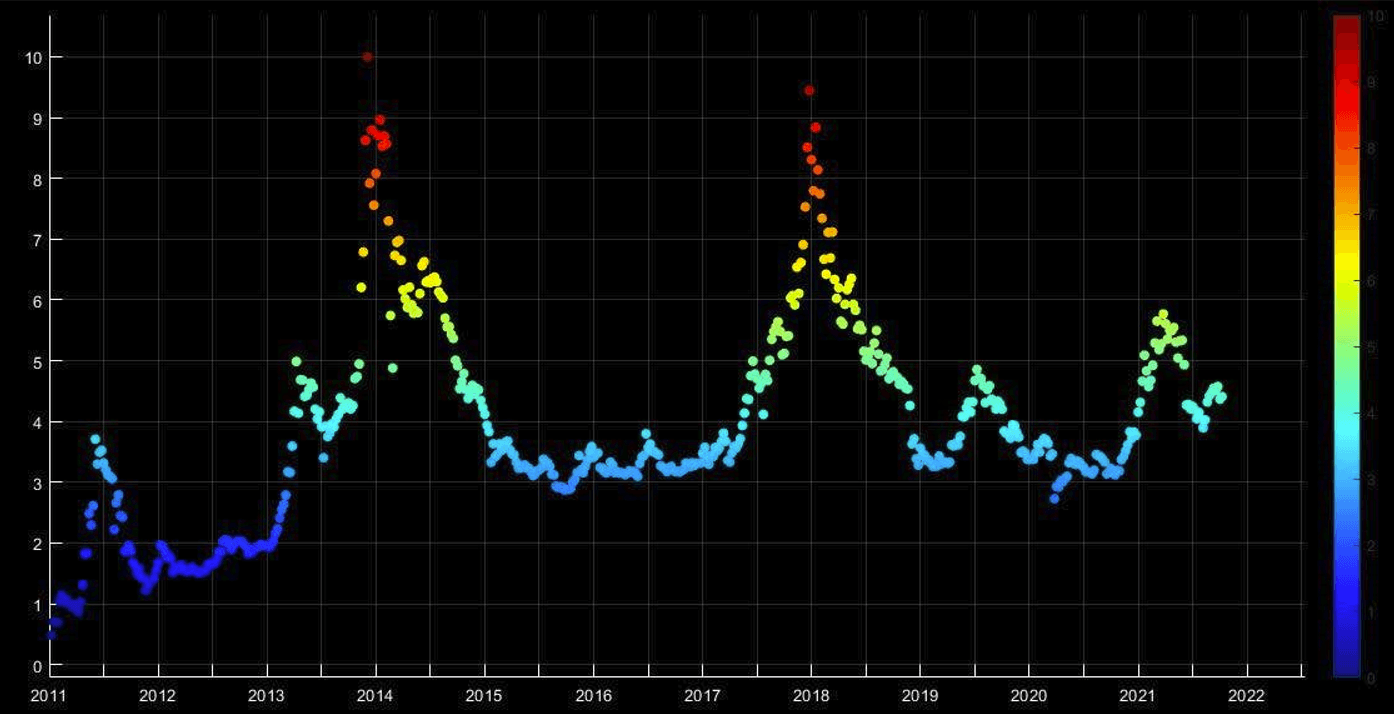
This model gives you the risk of holding Bitcoin on a scale from one to ten. The risk, in this case, means the likelihood of a huge correction in the near future.
I used this model to frame how aggressively I accumulated, held, or sold Bitcoin at different risk levels.
The model is shown below:
18. Sep. 2021
How I Used The Risk Model
I used it to “dynamically dolla" cost average” according to the risk levels.
Let me explain:
I invested more when the risk level was low and less when it was high.
An illustrative version of my strategy using the Risk Model:
| Risk Level: | Illustrative Action: |
|---|---|
| 1 | Invested $4000 |
| 2 | Invested $2000 |
| 3 | Invested $1000 |
| 4 | Invested $500 |
| 5 | Invested $250 |
| 6 | Held |
| 7 | Sold 5% of my BTC |
| 8 | Sold 15% of my BTC |
| 9 | Sold 30% of my BTC |
| 10 | Sold 60% of my BTC |
The Fair Value S2F Model:
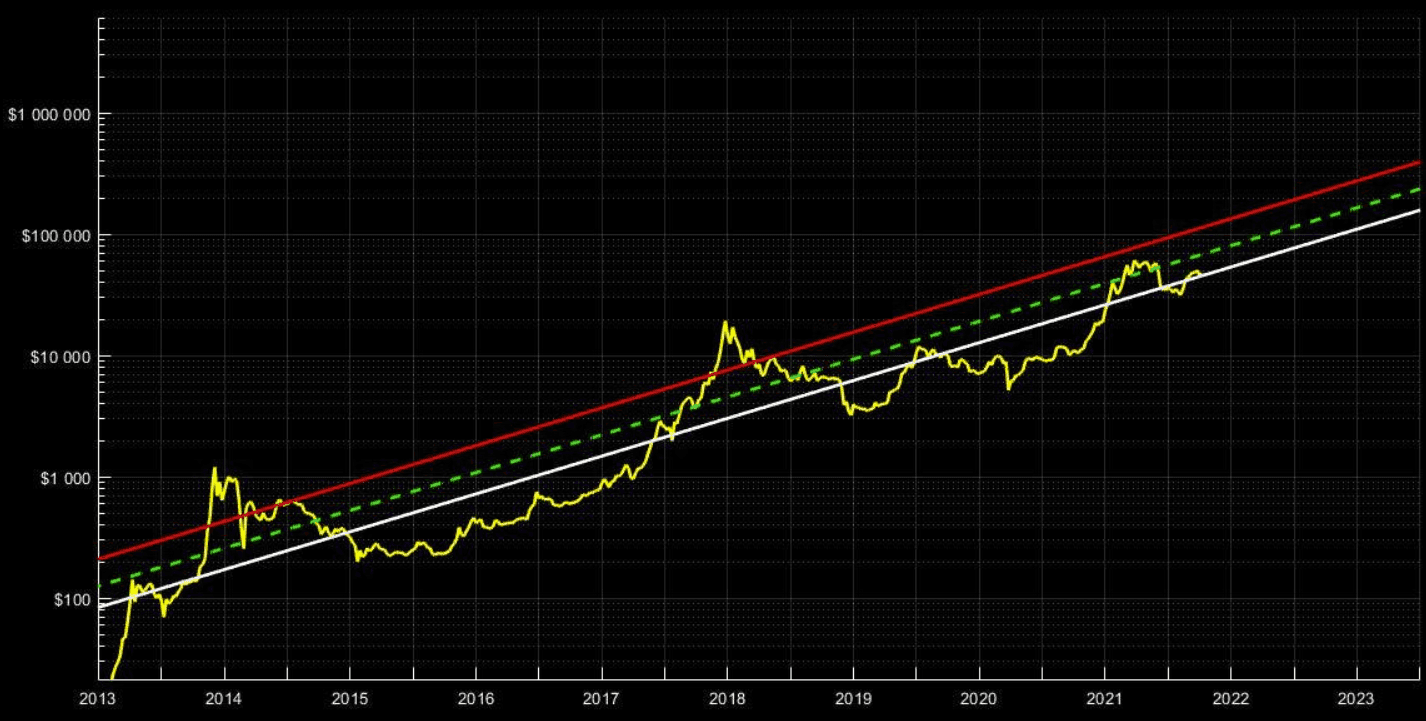
This one models the fair price of Bitcoin. The "fair price" is the price that Bitcoin "should" be at, based on a bunch of fundamental factors and a decade of historical price data.
The green dashed line is the fair value of Bitcoin:
18. Sep. 2021
How I Used The Fair Value S2F Model:
I regarded Bitcoin as cheap when the price was below the white line and expensive when it was above the red line.
Using this, my general guidelines at the time were:
I bought aggressively when Bitcoin was below the white line.
I bought moderately when the price was between the white and the green dashed line.
I held or sold moderately when the price was between the green dashed line and the red line.
I sold aggressively when the price was above the red line.
Using Technical Analysis In My Bitcoin Strategy:
Other than using my Bitcoin models, I also performed technical analysis to look for buy/sell opportunities. The goal was not to time daily or weekly moves, but to position around larger trends.
I analyzed several charts to decide whether to hold capital in Bitcoin, altcoins, or USD. The following were my top three priorities:
Analyzing BTC/USD:
This chart just shows you the USD price per Bitcoin - "how much USD can I get per BTC I have".
One example of the analysis I did, that saved me a lot of money, was this one:
From a newsletter in May of 2021:
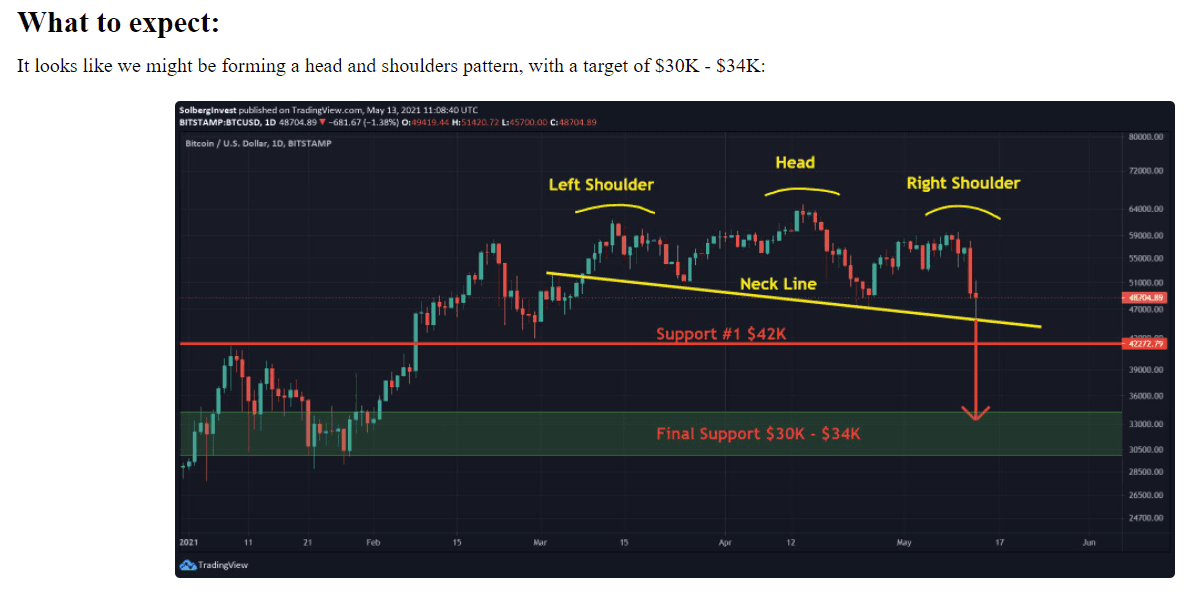
Only a few days later, the price crashed down to $30K (the "wick" hit $30,066 to be precise).
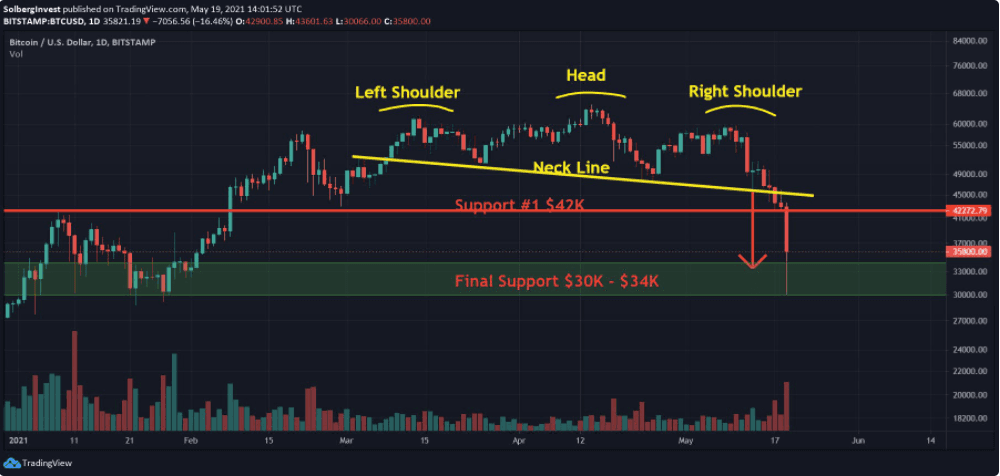
Do you see how analyzing the BTC/USD chart on a long timeframe can be useful for trading Bitcoin? This crash had been building up for more than two months, and when it happened it took less than a week...
I also described how I traded between Ethereum and Bitcoin in this historical strategy note.
Analyzing The Bitcoin Dominance:
The Bitcoin dominance (BTC.D from here on) is a metric showing how much of the total crypto market lies in Bitcoin.
For example, if the total crypto market is 1.5 Trillion USD, and the BTC.D is 70%, Bitcoin's market cap is equal to 70% of 1.5 Trillion = 1.05 Trillion.
Understanding this helped me frame Bitcoin seasons and altcoin seasons. The market shifts between focusing on Bitcoin and altcoins, and I used the dominance chart to respond to those shifts.
The way I used BTC.D when trading:
When BTC.D was high, I treated altcoins as relatively cheap and diversified more into altcoins than Bitcoin.
When BTC.D was low, I treated Bitcoin as relatively cheap and concentrated more heavily in Bitcoin.
Basically, I tried to do the opposite of what the market was doing.
In practice, I sold some BTC for altcoins when BTC.D was high and moved back toward BTC when it was low.
Example Of a BTC Investing/Trading Strategy:
Here is a simplified example of how I approached a $5,000 BTC portfolio at the time:
When I started recognizing patterns, I made small trades to test my framework. I generally kept each trade below 5% of the portfolio.
After gaining experience, I made larger trades and also began analyzing altcoin charts. This increased both the potential impact and the risk of each decision.
At some point I booked profits. I regarded greed as one of the biggest risks to the strategy.
Other Ways To Trade Bitcoin:
Day Trading. Buy and sell BTC with high frequency – multiple times per day. This requires high skill, and extreme mental resilience. NOT for beginners.
Futures Trading. Make bets on what the future price of Ethereum will be. This is NOT for beginners either. This is mostly used by “rich people” and institutions. However, for the right people futures trading offer a lot of upsides (and risk management options).
GBTC. At the time, the Grayscale Bitcoin Trust was one way to gain indirect Bitcoin exposure through a security that could be held in some investment accounts.
Bitcoin-Correlated Securities. Stocks in Bitcoin mining companies and exchanges such as Coinbase offered another form of indirect exposure.
Conclusion:
With the goal of producing higher returns than just holding would, my approach at the time was:
I swing-traded according to the BTC/USD chart and Bitcoin dominance, typically with a 3-6 month perspective.
I booked profits gradually when risk was above 7 in the Risk Model or when the Fair Value S2F Model classified the price as expensive.