

As a math student (and nerd) I spend a lot of my time looking at mathematical models predicting the future price of Bitcoin, and I always look for new Bitcoin models.
Well, I've taken it a step further:
I made two Bitcoin models for 2021-2024. One was a logarithmic band similar to logarithmic growth curves. The other used the stock-to-flow of Bitcoin and several commodities to estimate a model-based fair value.
I'll go through them in this article, and show you why I think they're useful for Bitcoin investors. Let's start with the "fair value" one:
The Fair Value S2F Model (Fair value of Bitcoin)
This one is a complete original. It's inspired from the stock to flow model by PlanB, as the stock to flow plays a major role in this model.
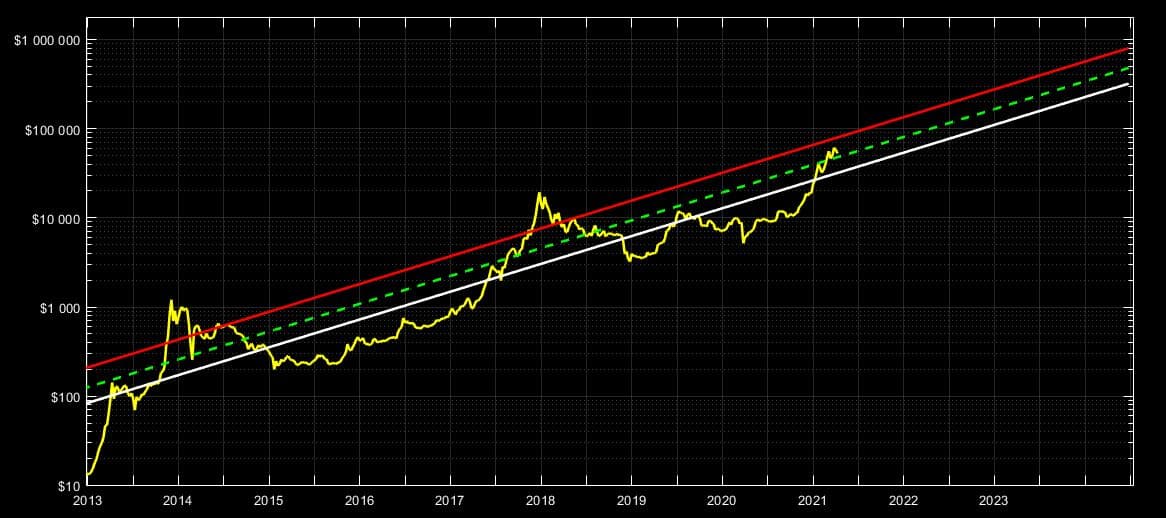
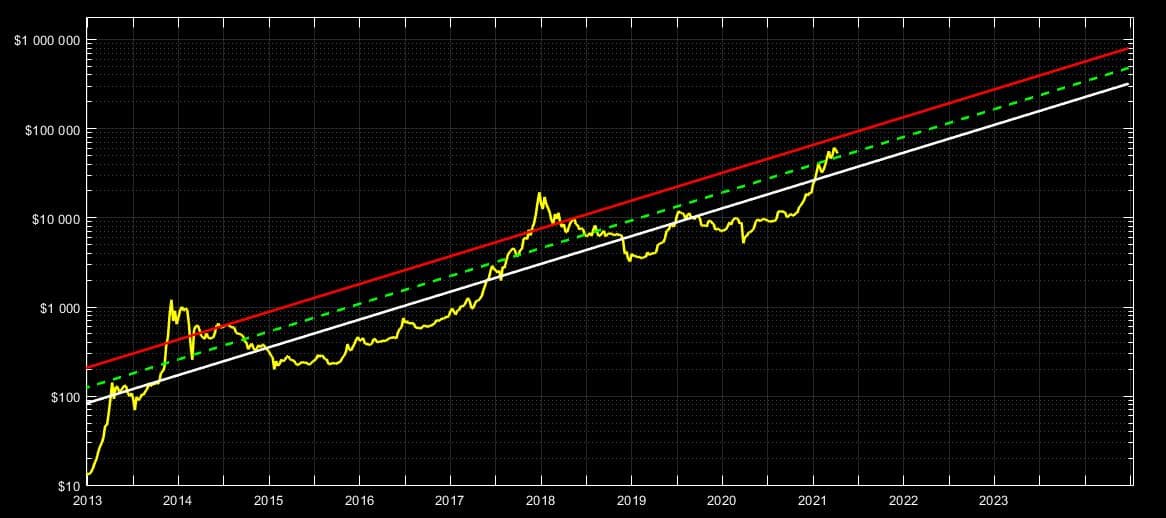
This is what it looks like: (You can see the price on the left vertical axis, notice that it's on a logarithmic scale (every tick up is a 10x).)
How to Read This Model:
The green dashed line is the model's estimate of Bitcoin's "fair value".
If the Bitcoin price is below the white line, the model classifies it as relatively cheap or oversold.
If the Bitcoin price is above the red line, the model classifies it as relatively expensive or overbought.
How I Used This Model:
If the price was within the red and white lines, at its modelled fair value, I would slowly accumulate, or hold, Bitcoin.
If the price was below the white line, I would accumulate more aggressively.
If the price was above the red line, I would gradually sell Bitcoin.
Although the construction was complicated, I used the three zones above as a simple decision framework.
It reduced the amount of guesswork by basing my decisions on a model and historical data rather than an unstructured price bet.
Why I Called This a Fair-Value Model
I gathered data about the supply (stock) and mining rate (flow) of several commodities, as well as historical numbers for Bitcoin, and made this data table together with the respective market value: (sources: Statista, coinworld, providentmetals, companiesmarketcap, Bitcoin.com, Metals/Medium, and a few others)
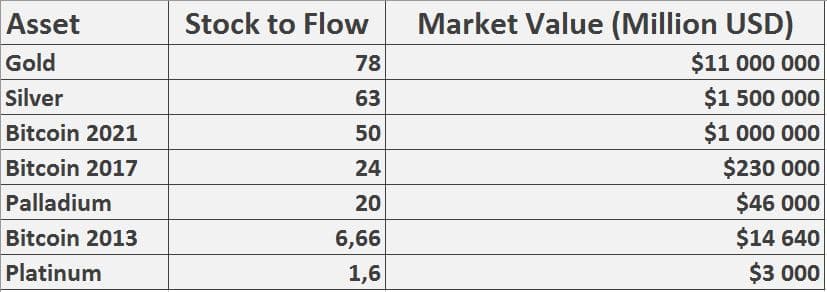
I used this data, and made this comparison of the stock to flow of each of them, side by side with a comparison of their market value. This is to basically just to point out the correlation between the stock to flow of and the market value an asset:
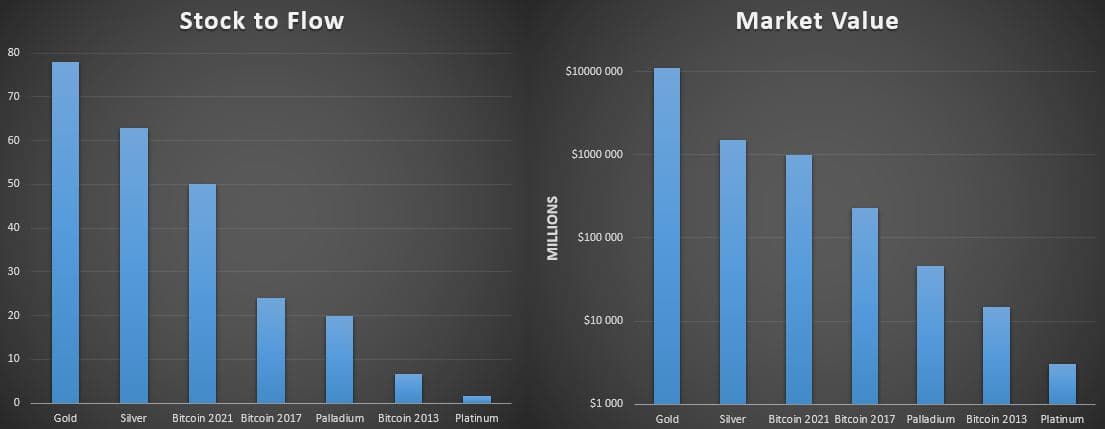
Notice how the height of each respective pillar is similar when looking at the stock to flow (left) and the market value (right)?
Another thing I should point out is that the market value chart (right) has it's vertical axis, the axis showing the market value, increasing exponentially. Every tick up is a 10x.
In this small sample, market value appeared to have an exponential relationship with stock-to-flow.
Why do we care about this? Because the stock to flow of Bitcoin doubles every four years due to the halving.
Under this model, I assumed that Bitcoin's price would increase as stock-to-flow rose after each halving, as it had in the historical sample.
Using the same data as above, I made another chart. Notice how the time variable is replaced by the stock to flow:
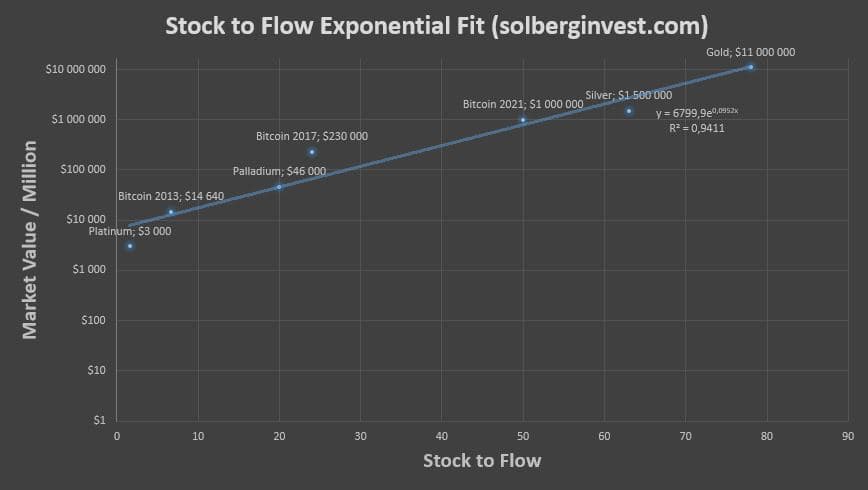
The data points are the assets from the data table above. The blue line going between/through them is the fitted exponential trend line.
Beneath the line, at the end, you see the function that describes the trend line:
y = 6799e^0.0952x.
Usually, x is the time variable, but in this function x is the stock to flow.
In other words, the trend line shows how to calculate the market value of an asset as a function of its stock to flow.
I used this function, and adjusted it to fit the price of Bitcoin, as the chart above only shows the market cap of Bitcoin.
Also had to change back from stock to flow, to time, on the x-axis.
This works, because the stock to flow of Bitcoin is itself a function of time.
Summarized, this was my general idea:
To Use the function above, adjust it to predict the price instead of market cap, as well as perform a variable substitution from "stock to flow" to "time", which works because the stock to flow of Bitcoin is itself a function of time. I also wanted it to be a continues, monotonically increasing and (of course) exponential function.
My work resulted in a model that estimated Bitcoin's fair-value range and how far price sat above or below it:
How It Differs From The Stock to Flow Model
The fair value line on this model takes into consideration the next halving event. In the stock to flow model for example, the fair value of Bitcoin is more or less constant, but spikes at each halving.
Technically, that's the right way to think about it, because the stock to flow of Bitcoin is more or less constant between the halvings. It doubles over a short period of time right after each halving, but goes back to stay constant until the next halving.
However, this seems to simple.
In my opinion, the fair-value estimate should price in the next programmed halving to some extent.
The halvings are hard coded into Bitcoin and alter the rate of new supply. In my view, the model should therefore price them in to some extent.
The Fair Value S2F Model does this.
The model takes the next halving, as well as how far away it is, into consideration when assigning the fair value.
This produced a more continuous estimate between halving events.
This model does not predict a specific Bitcoin price, as this is not it's function nor purpose.
The purpose of this model was to frame Bitcoin's relative market risk and whether price looked cheap or expensive against the model at a given time.
I used it to estimate the relative probability of a price decline or rally.
At the time, I planned to use this model alongside others, selling gradually near the red line and accumulating more aggressively below the white line.