

This article documents the Bitcoin Risk Model I used in 2021 and how I incorporated it into a rules-based strategy.
The model mapped historical market conditions onto a scale from one to ten. Higher readings were associated with a greater chance of correction; lower readings marked potential accumulation zones.
I'll explain how I read the model and how it informed my decisions.
The Risk Model - Bitcoin
This model estimated the relative risk of holding Bitcoin from its historical price behavior, but what did that mean in practice?
1) On a scale from 1-10, it framed whether conditions looked relatively favorable or unfavorable for adding Bitcoin. Lower readings represented the model's more favorable historical zones.
2) It estimated the relative likelihood of a major correction. Higher readings implied greater risk in the model; lower readings implied less.
3) I also used high readings as potential signals to reduce exposure.
This is what it looks like:
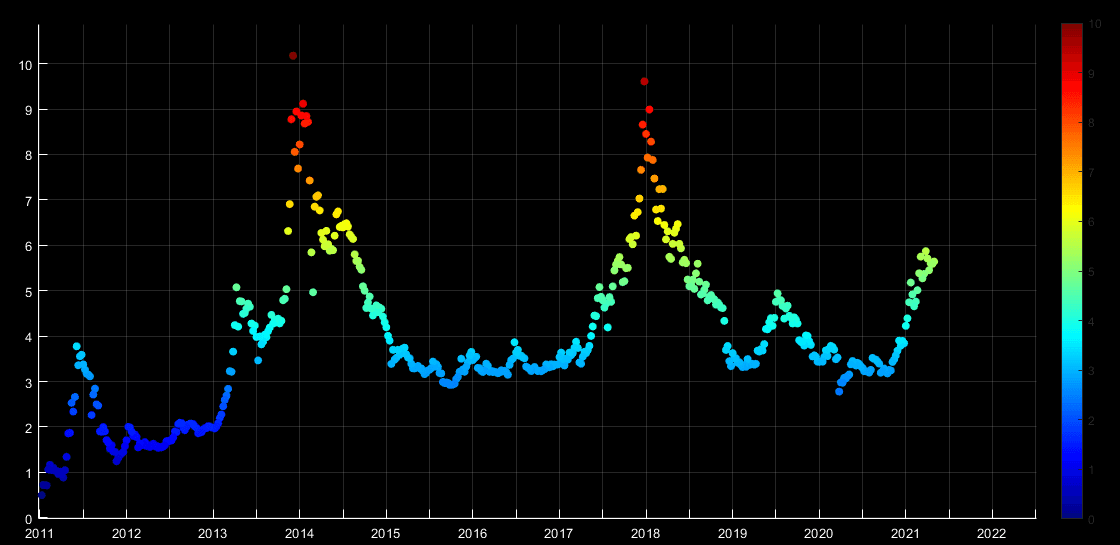
The risk is shown on the left y-axis, and it's also colorcoded. Dark blue = risk level 1, dark red = risk level 10.
We see that the peaks we had in 2013 and 2017 both reached a risk level above 9.
On 12 April 2021, the model was at a mid-range reading of 5.7.
At the time, I expected the model's risk reading to rise if the Bitcoin rally continued.
For me, that made a predefined exit strategy important because Bitcoin drawdowns can develop quickly.
How I Used The Risk Model
One way I used the model was to "dynamically dollar cost average" according to its risk levels.
Let me explain:
Suppose a Bitcoin investment strategy uses dollar-cost averaging with a hypothetical $1,000 monthly contribution.
The objective in this example is to lower the average purchase price over time.
My model-based variation adjusted the hypothetical monthly amount according to the risk reading.
The example allocated more at lower readings and less at higher readings.
A practical example of a strategy using The Risk Model:
| Risk Level: | Invested Amount: |
|---|---|
| 1 | Invest $4000 |
| 2 | Invest $2000 |
| 3 | Invest $1000 |
| 4 | Invest $500 |
| 5 | Invest $250 |
| 6 | Hold |
| 7 | Sell 5% of your BTC |
| 8 | Sell 15% of your BTC |
| 9 | Sell 30% of your BTC |
| 10 | Sell 60% of your BTC |
Example strategy using The Risk Model (dynamically dollar cost averaging)
The benefit for me was a repeatable framework that reduced reliance on price predictions, gut feeling or commentary from other market participants.